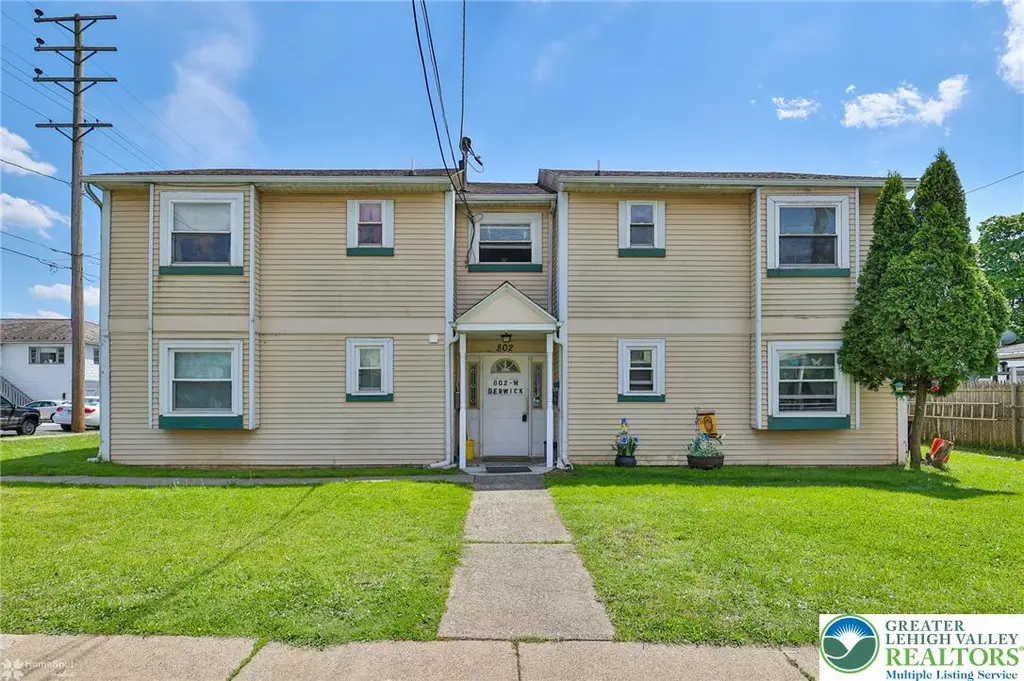
802 W Berwick St
Easton, PA 18042
$525,000C+
16 bd · 16.0 ba ·
3,120 sqft ·
Built 1970
· MultiFamily
· Pending
· 10 DOM
Cashflow @ list (25.0% down · 7.5%)
Estimated rent
$8,186/mo
Mortgage (P&I)
−$2,753
Tax + insurance
−$875
HOA
−$0
Vac / Maint / Mgmt
−$1,719
Net cashflow
$2,839/mo
Annual
$34,065/yr
Cap rate
12.78%
Cash-on-cash
23.17%
DSCR
2.03
1% rule
1.56%
Cash to close
$147,000
Investor read
- This is a 4 × 4-bed/4.0-bath units multifamily listed at $525k. Condition is rated fair.
- At list price, monthly cash flow is $3k ($34k/yr) — positive. Per door: $710/mo.
- The deal already cash-flows at list — no discount required.
- Meets the 1% rule at list price ($8k rent vs $525k).
- Only 10 days on market — expect competitive offers; lowballing is unlikely to land.
- Local home prices are declining (-3.0%/yr); year-one equity from $4k of loan paydown is wiped out by about $16k of value loss. Plan a longer hold.
- Location reads 84/100 on livability (#92 in PA, #667 nationally) — a professional / high-income tenant draw. Strengths: amenities A+, cost of living A+, housing A+; Watch: schools C-.
- Easton Area SD (suburban): math 31% / reading 44% proficiency, ranked #364 of 539 in PA (top 68%) — families likely to look elsewhere, expect single-tenant / working-renter base with shorter leases.
- Market conditions: Rents rising fast (+4.9%/yr); 185 active listings in the ZIP; solid renter incomes; 567 units permitted in Northampton County in 2024 (151 in 5+ unit buildings).
- At projected returns (-3.0% appreciation + 4.9% rent growth), your $147k cash investment doubles in ~5 years — after that, you're playing with house money.
- Climate carrying-cost: extreme-heat days projected 7→15/yr by 2055 (HVAC capex compounding) — expect insurance premiums to compound above CPI over the hold.
- Cap rate 12.8% vs local median 4.2% in Easton — top-decile yield for the area; either an underpriced asset or a hidden risk that comps aren't pricing in. Stress-test before assuming the spread holds.
- At $8,186/mo this rent would consume 127% of the median local household income ($78k/yr) (locally 1590% of renters already pay >50% of income on rent) — very limited rent-growth headroom before tenants either downsize or default.
Questions for listing agent
- Can we see the unit-by-unit rent roll, current vacancy, and any below-market leases? What's the average tenancy length?
- What capital expenditures (roof, boiler, parking lot, exteriors) have been made in the last 5 years, and what's planned in the next 2?
- Have any recent inspections been done? Can we get a copy of the seller's disclosures and any deferred-maintenance estimates?
- Built in 1970 — when were the roof, HVAC, electrical panel, plumbing, and water heater last replaced?
- Is there a deadline driving the sale (1031 exchange, divorce, estate, relocation)? That informs how much negotiation room exists.
- What's the average days-on-market for RENTAL listings here right now (not sales)? A rising rental-DOM trend means longer vacancies and softer asking-rent achievability than the comps imply.
- What's the recent tenant-quality profile in this submarket — average credit score on applications, eviction rate, late-payment / NSF rate, and stable-employment percentage? A property-management company in the area should have these aggregated.
- How much new apartment / multifamily construction is in the pipeline within 1–3 miles? Heavy new supply (>2% of stock underway) typically softens rents 12–24 months out; light construction supports rent growth.
Repairs flagged (vision-AI assessment)
- Moderate: Exterior siding — Weathered and some areas show discoloration
- Moderate: Interior walls — Paint appears chipped and uneven in some areas
- Moderate: Flooring — Carpet in living areas appears worn
- Moderate: Kitchen cabinets — Appears dated and some items are cluttered
- Moderate: Bathroom fixtures — Appears old and some areas show discoloration
CashFlowRE · CFR-BGC82TA4Z5CDMS
· Data 3 weeks ago
cashflowre.app · 2026-05-29