 Fourplex
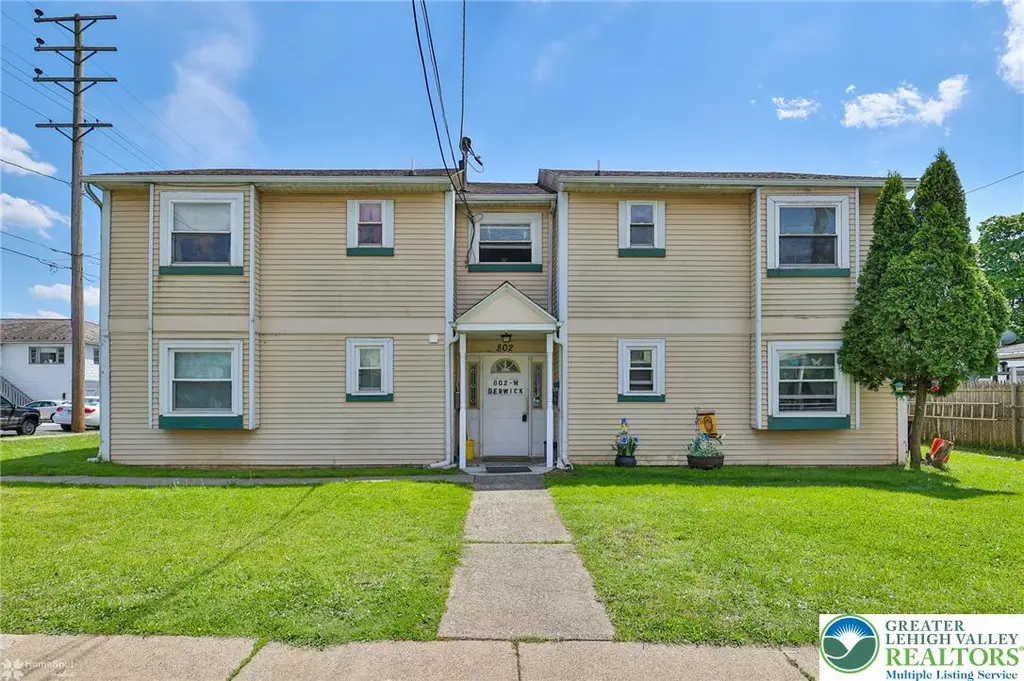
802 W Berwick St · Easton, PA
Flood risk 1/10 · Minimal
- FEMA flood zone
- X (unshaded)
- Chance of flooding over 30 yrs
- 0.0%
- Est. flood insurance / yr
- $507 – $1,088
Fire risk 3/10 · Minor
- Est. fire insurance / yr
- $511 – $949
Heat risk 5/10 · Moderate
- Hot days now (above 100°F)
- 7 days/yr
- Hot days in 30 yrs
- 15 days/yr
Wind risk 4/10 · Minor
- Chance of severe wind over 30 yrs
- 16.0%
Air-quality risk 3/10 · Minor
- Unhealthy air days now
- 3 days/yr
- Unhealthy air days in 30 yrs
- 5 days/yr
Risk factors via First Street. Map © Google.
Why this score? — see what drove the C+ grade
The composite is a weighted blend of 9 inputs, each scored 0–100. Each bar is that input's sub-score; the figure is the points it added to the 100-point composite (weight × sub-score).
- Cash flow +30.0/30.0
- 1% rule +10.0/10.0
- DSCR +10.0/10.0
- Livability +4.2/5.0
- Rent growth +3.7/5.0
- Schools +3.3/10.0
- Condition / age +2.2/5.0
- ARV discount +0.0/15.0
- Appreciation +0.0/10.0
$525,000
🖨 Deal sheet 📄 Offer letter ✓ Due diligence
Multi-family units
County records classify this as Multi-Family (2-4 Unit). Listing-text estimate: 4 units. confirmed
Listing remarks
Perfect for an investor looking for immediate cash flow and stability. This centrally located 4- unit building is fully rented and has some long-term tenants. One unit has been updated with new flooring and fresh paint and has recently been rented. Tenants are responsible for water and sewer. Keeping overhead lower for new owner. Parking area for 1 car per unit is in the lot behind building.
Key facts
- 0.26 acre lot
- 4 parking spots
- Built 1970
Property features AI
Finance
- Financial info: Operating expenses reported: $2,247; Water/sewer expense reported: $103; Electric expense reported: $404; Insurance expense reported: $1,930
Exterior
- Parking: 4 parking spaces
- Security: Smoke detector(s)
- Utilities: Public water; Public sewer
- Home design: 2-story building; Vinyl siding
- Construction: Vinyl siding construction
- Exterior features: Lot approximately 0.26 acre; Zoned 10RMD
Interior
- Bedrooms: 4 bedrooms
- Bathrooms: 4 full bathrooms
- Heating & cooling: Baseboard heating; Wall unit cooling
- Interior features: Smoke detectors installed
Neighborhood map
What this means for you Summary
Snapshot
- This is a 4 × 4-bed/4.0-bath units multifamily listed at $525k. Condition is rated fair.
Deal economics
- At list price, monthly cash flow is $3k ($34k/yr) — positive. Per door: $710/mo.
- The deal already cash-flows at list — no discount required.
- Meets the 1% rule at list price ($8k rent vs $525k).
- Cap rate 12.8% vs local median 4.2% in Easton — top-decile yield for the area; either an underpriced asset or a hidden risk that comps aren't pricing in. Stress-test before assuming the spread holds.
Location & tenants
- Location reads 84/100 on livability (#92 in PA, #667 nationally) — a professional / high-income tenant draw. Strengths: amenities A+, cost of living A+, housing A+; Watch: schools C-.
- Easton Area SD (suburban): math 31% / reading 44% proficiency, ranked #364 of 539 in PA (top 68%) — families likely to look elsewhere, expect single-tenant / working-renter base with shorter leases.
- Market conditions: Rents rising fast (+4.9%/yr); 185 active listings in the ZIP; solid renter incomes; 567 units permitted in Northampton County in 2024 (151 in 5+ unit buildings).
- At $8,186/mo this rent would consume 127% of the median local household income ($78k/yr) (locally 1590% of renters already pay >50% of income on rent) — very limited rent-growth headroom before tenants either downsize or default.
Forward outlook
- Local home prices are declining (-3.0%/yr); year-one equity from $4k of loan paydown is wiped out by about $16k of value loss. Plan a longer hold.
- At projected returns (-3.0% appreciation + 4.9% rent growth), your $147k cash investment doubles in ~5 years — after that, you're playing with house money.
Negotiation context
- Only 10 days on market — expect competitive offers; lowballing is unlikely to land.
Risks & watch-outs
- Climate carrying-cost: extreme-heat days projected 7→15/yr by 2055 (HVAC capex compounding) — expect insurance premiums to compound above CPI over the hold.
Questions for the listing agent
- Can we see the unit-by-unit rent roll, current vacancy, and any below-market leases? What's the average tenancy length?
- What capital expenditures (roof, boiler, parking lot, exteriors) have been made in the last 5 years, and what's planned in the next 2?
- Have any recent inspections been done? Can we get a copy of the seller's disclosures and any deferred-maintenance estimates?
- Built in 1970 — when were the roof, HVAC, electrical panel, plumbing, and water heater last replaced?
- Is there a deadline driving the sale (1031 exchange, divorce, estate, relocation)? That informs how much negotiation room exists.
- What's the average days-on-market for RENTAL listings here right now (not sales)? A rising rental-DOM trend means longer vacancies and softer asking-rent achievability than the comps imply.
- What's the recent tenant-quality profile in this submarket — average credit score on applications, eviction rate, late-payment / NSF rate, and stable-employment percentage? A property-management company in the area should have these aggregated.
- How much new apartment / multifamily construction is in the pipeline within 1–3 miles? Heavy new supply (>2% of stock underway) typically softens rents 12–24 months out; light construction supports rent growth.
Investment metrics
- 1% rule
- 1.56% ✓
- Cap rate
- 12.78%
- Cash-on-cash
- 23.17%
- DSCR
- 2.03
- GRM
- 5.3
CMA / ARV
- ARV (median comp)
- $449,015
- List price
- $525,000
- Delta
- 16.92%
- Verdict
- OVERPRICED
- Comps
- 20 within 1.0 mi
Projected returns pro-forma
-3.0% appreciation · 4.94% rent growth · sell at horizon
- IRR
- 18.4%
- Equity multiple
- 1.76×
- Total profit
- $112,142
- Equity at exit
- $78,279
- IRR
- 28.1%
- Equity multiple
- 3.72×
- Total profit
- $400,506
- Equity at exit
- $45,392
Cash invested: $147,000 (down + closing). Projections, not guarantees.
Landlord ↔ Tenant lean methodology
- Overall (STATE)
- 62 Landlord-Friendly
- State Pennsylvania
- 62 Landlord-Friendly · EVEN
- County
- — inherits STATE
- City
- — inherits STATE
ZIP-level market 18042
- Rents YoY
- 4.9%
- Active inventory
- 185
- Price-to-rent
- 21.4×
Monthly cashflow live
- Estimated rent
- $8,186 high interval (Pro) →
- Mortgage (P&I)
- −$2,753
- Tax est. 1.5%
- −$656 /mo · $7,875/yr
- Insurance
- −$219
- HOA
- −$0
- Vacancy / Maint / Mgmt
- −$1,719
- Net cashflow
- $2,839
Break-even live
4-unit breakdown (identical units grouped — click to expand)
| Units | Beds | Baths | Est. rent |
|---|---|---|---|
| 4× units | 4 | 4 | $8,184 |
| #1 | 4 | 4 | $2,046 |
| #2 | 4 | 4 | $2,046 |
| #3 | 4 | 4 | $2,046 |
| #4 | 4 | 4 | $2,046 |
| Total (4 units) | $8,186 | ||
UW: 25.0% down · 7.5% · 30yr · 1.5% tax · 5.0% vac · 8.0% maint · 8.0% mgmt
Financing live
Cash to close
- Down payment
- $131,250
- Closing costs
- $15,750
- Reserves months
- —
- Total cash needed
- —
Loan-product check · same deal, 3 products live
Conventional
25% down · 7.5% · 30yr
- Down + closing
- —
- Monthly P&I
- —
- Monthly cashflow
- —
- DSCR
- —
- Eligible?
- —
Personal DTI + credit; lowest rate.
DSCR
20% down · 8.5% · 30yr
- Down + closing
- —
- Monthly P&I
- —
- Monthly cashflow
- —
- DSCR
- —
- Eligible?
- —
No personal income docs; deal must DSCR.
Hard money
10% down · 12.0% · 12mo
- Down + closing
- —
- Monthly P&I
- —
- Monthly cashflow
- —
- DSCR
- —
- Eligible?
- —
Short-term bridge; refi at stabilization.
Listing history 2 events
-
2026-05-18status Pending 394-char remark
-
2026-05-08$525,000 Active 394-char remark
ⓘ Source: listings_history table (triggers on properties + properties_extension) + one-shot
backfill from property_details.listing_events for pre-trigger history.
Climate risk First Street
- Flood 1/10 Low FEMA zone X (unshaded) · 0% chance over 30 yrs
- Wildfire 3/10 Moderate
- Heat 5/10 Major 7 d/yr ≥100°F today · 15 d/yr by 30 yrs out
- Wind 4/10 Moderate 16% chance of damaging wind over 30 yrs
- Air quality 3/10 Moderate 3 unhealthy d/yr today · 5 by 30 yrs out
Nearby sold comps map
Loading sold comps map…
Walkable amenities ~0.75 mi
Loading nearby amenities…
Taxation est. · year 1
- Rental income
- $98,232
- − Mortgage interest
- −$29,408
- − Property taxes
- −$7,875
- − Insurance
- −$2,625
- − Repairs & maintenance
- −$7,859
- − Management
- −$7,859
- − Depreciation
- −$15,273
- Taxable income
- $27,334
- Est. tax owed @ 24.0%
- −$6,560
- After-tax cash flow
- $27,505/yr
For passive investors: Depreciation is non-cash, so a rental often shows a tax loss while cash-flowing — sheltering income. Rental losses are passive: they offset passive income freely, and up to $25,000/yr can offset ordinary (W-2) income if you actively participate and your MAGI is under $100k (phasing out to $0 by $150k); unused losses carry forward. On sale, claimed depreciation is recaptured at up to 25%, and gains may owe capital-gains tax (a 1031 exchange can defer both). Figures are a year-1 estimate at your 24.0% rate — not tax advice; consult a CPA.
Condition & rehab AI · 12 photos
This 4-unit property requires moderate renovations to improve its condition and increase its value. Exterior painting, flooring replacement, kitchen updates, and bathroom fixture replacement are recommended.
Repairs flagged
- Moderate Exterior siding — Weathered and some areas show discoloration
- Moderate Interior walls — Paint appears chipped and uneven in some areas
- Moderate Flooring — Carpet in living areas appears worn
- Moderate Kitchen cabinets — Appears dated and some items are cluttered
- Moderate Bathroom fixtures — Appears old and some areas show discoloration
Value-add opportunities
- Both Exterior painting — Fresh paint can improve curb appeal and value
- Both Flooring replacement — New flooring can improve living spaces and rental appeal
- Both Kitchen cabinet updates — Modernizing the kitchen can attract more buyers and renters
- Both Bathroom fixture replacement — Upgrading bathrooms can increase both resale and rental value
Renovation cost estimate screening
| Repair item | Severity | Est. cost |
|---|---|---|
| Exterior siding · Weathered and some areas show discoloration | Moderate | $3,000–15,000 |
| Interior walls · Paint appears chipped and uneven in some areas | Moderate | $3,000–15,000 |
| Flooring · Carpet in living areas appears worn | Moderate | $3,000–15,000 |
| Kitchen cabinets · Appears dated and some items are cluttered | Moderate | $3,000–15,000 |
| Bathroom fixtures · Appears old and some areas show discoloration | Moderate | $3,000–15,000 |
| Total estimated repair cost · 5 items | $15,000–75,000 |
Value-add ROI direction
- Both Exterior painting — Fresh paint can improve curb appeal and value ↑
- Both Flooring replacement — New flooring can improve living spaces and rental appeal ↑
- Both Kitchen cabinet updates — Modernizing the kitchen can attract more buyers and renters ↑
- Both Bathroom fixture replacement — Upgrading bathrooms can increase both resale and rental value ↑
ⓘ Cost ranges are severity-bucket heuristics (US national rule-of-thumb). Get contractor quotes + a written scope before underwriting a rehab budget.
Schools (NCES district)
- District
- Easton Area SD
- NCES district ID
- 4208850
- Math proficiency
- 31% ▼ -2.00%
- Reading proficiency
- 44% ▼ -11.00%
- Median HH income
- $61,390
- Composite
- 33.46/100
- National rank
- #5457
- State rank
- #364 of 539 in PA
Livability — Easton
- Score
- 84/100
- State rank
- #92
- US rank
- #667
Category grades
Schools grade is shown separately in the Schools card above.
Census & demographics
- Census place
- Easton, PA
- County
- Northampton County · 236,814 people
- City population
- 75,961
- Metro
- Allentown-Bethlehem-Easton, PA-NJ
- Population (ZIP)
- 45,532
- Household income
- $77,556
- Rent vs Own
- Severe rent burden
- 1590.0
Population outlook (Northampton County) Hauer SSP2
- Today (2025)
- 312,227 people
- By 2030
- 314,769 · +0.8%
- By 2040
- 316,914 · +1.5%
- By 2050
- 318,037 · +1.9%
- By 2075
- 334,003 · +7.0%
- By 2100
- 344,696 · +10.4%
Race, ethnicity, and origin ACS 2023
- Neighborhood character
- Diverse neighborhood (Simpson 0.61)
- Race & ethnicity
- White 57% Hispanic / Latino 21% Black 12% Two or more races 12% Asian 3%
- Hispanic origin (detail)
- Mexican 3% Puerto Rican 7% Dominican 3%
- Common ancestry
- Romanian 3% Polish 2% Iranian 1%
- Foreign-born
- 13% · Canada, China, Jamaica
- Languages at home
- 80% English-only · Spanish 15% Other Indo-European 1% Arabic 1%
Political lean MEDSL · Northampton
- 2024 margin
- Toss-up / Even · D 48.6% · R 50.4%
- 2008→2024 swing
- -14.1pp toward R · 2008: 12.3pp · 2024: -1.8pp
- All cycles
- 2024: R+1.8 2020: D+0.7 2016: R+3.8 2012: D+4.6 2008: D+12.3
Not yet ingested
- Civics
- —
Market trends
- HPI YoY
- ▼ -460.52%
- Current HPI
- 254.8776
- Rent YoY
- ▲ 4.94%
- Metro
- Allentown-Bethlehem-Easton, PA-NJ
- State GDP YoY
- ▲ 1.68%
- F500 in state
- 34
Industry mix (Fortune 500 HQ in PA)
| Industry | F500 HQs | Revenue |
|---|---|---|
| Healthcare | 2 | $309B |
|
||
| Insurance | 2 | $27B |
|
||
| Telecommunications / Media | 1 | $124B |
|
||
| Industrial Distribution | 1 | $22B |
|
||
| Financial Services | 1 | $20B |
|
||
| Chemicals / Materials | 1 | $18B |
|
||
Price history
2 events — show timeline
- 2026-05-18 Pending — GLVRMLS
- 2026-05-08 Listed $525,000 GLVRMLS
Cash-flow waterfall
monthlySold comps — $/sqft
last 12 mo · ≤1 miLoading sold comps…