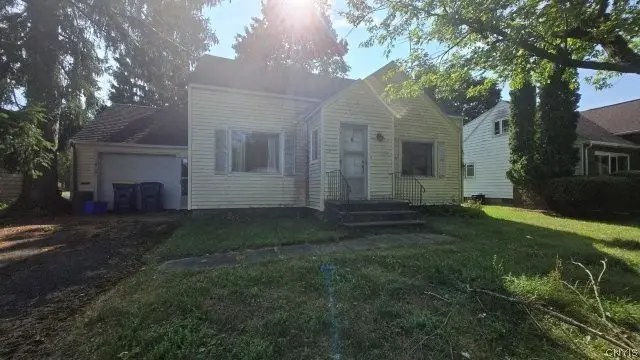
415 Meadow Rd
Westvale, NY 13219
$139,900B-
3 bd · 1.5 ba ·
1,358 sqft ·
Built 1950
· SingleFamily
· Pending
· 2 DOM
Cashflow @ list (25.0% down · 7.5%)
Estimated rent
$1,900/mo
Mortgage (P&I)
−$734
Tax + insurance
−$523
HOA
−$0
Vac / Maint / Mgmt
−$399
Net cashflow
$245/mo
Annual
$2,938/yr
Cap rate
8.39%
Cash-on-cash
7.50%
DSCR
1.33
1% rule
1.36%
Cash to close
$39,172
Investor read
- This is a 3-bed/1.5-bath single-family listed at $140k.
- At list price, monthly cash flow is $245 ($3k/yr) — positive.
- The deal already cash-flows at list — no discount required.
- Meets the 1% rule at list price ($2k rent vs $140k).
- Only 2 days on market — expect competitive offers; lowballing is unlikely to land.
- Local home prices are declining (-3.0%/yr); year-one equity from $967 of loan paydown is wiped out by about $4k of value loss. Plan a longer hold.
- Location reads 80/100 on livability (#105 in NY, #1,731 nationally) — a professional / high-income tenant draw. Strengths: employment A+, housing A+, health & safety A; Watch: amenities F, commute F.
- Westhill Central School District (suburban): math 57% / reading 64% proficiency, ranked #212 of 590 in NY (top 36%) — acceptable for families but not a draw, mixed tenant base, ~2y average lease; only 11% free/reduced lunch — higher-income household profile.
- Zoned schools: Cherry Road Elementary School (math 65% / reading 72%, grade B+, #517 of 2,108 statewide, top 25%, 365 students, 32% FRL); Onondaga Hill Middle School (math 39% / reading 60%, grade C, #280 of 729 statewide, top 40%, 554 students, 32% FRL); Westhill High School (math 98% / reading 70%, grade A, #409 of 1,100 statewide, top 39%, 550 students, 25% FRL) — zoned schools average 29% FRL vs 11% district-wide (18 pts higher); higher-poverty schools than district average — tighter screening recommended.
- Watch-outs: property tax is 4.0% of price; built in 1950 — expect roof / HVAC / electrical / plumbing capex.
- Market conditions: 53 active listings in the ZIP; 3 comparable units currently listed for rent nearby; rentals at typical pace (median 17d on market — plan ~3-4 weeks tenant-placement turnaround); solid renter incomes; 616 units permitted in Onondaga County in 2024 (256 in 5+ unit buildings).
- Onondaga County population projected to shrink 9% by 2050 — rents likely to lag national; underwrite the cash flow, not the appreciation.
- Cap rate 8.4% vs local median 3.9% in Westvale — top-decile yield for the area; either an underpriced asset or a hidden risk that comps aren't pricing in. Stress-test before assuming the spread holds.
Questions for listing agent
- Built in 1950 — when were the roof, HVAC, electrical panel, plumbing, and water heater last replaced?
- Property tax is high relative to price — has the assessment been appealed recently, and will the sale trigger a re-assessment?
- Is there a deadline driving the sale (1031 exchange, divorce, estate, relocation)? That informs how much negotiation room exists.
- Schools are A-rated — typically a magnet for longer-tenancy family renters. What's the average tenant stay here, and is there a school-zone premium baked into asking?
- What's the average days-on-market for RENTAL listings here right now (not sales)? A rising rental-DOM trend means longer vacancies and softer asking-rent achievability than the comps imply.
- What's the recent tenant-quality profile in this submarket — average credit score on applications, eviction rate, late-payment / NSF rate, and stable-employment percentage? A property-management company in the area should have these aggregated.
- How much new for-sale + rental construction is in the pipeline within 1–3 miles? Heavy new supply typically softens prices + rents 12–24 months out; constrained supply supports both.
CashFlowRE · CFR-BH200T9V6XD3E6
· Data 1 week ago
cashflowre.app · 2026-05-29