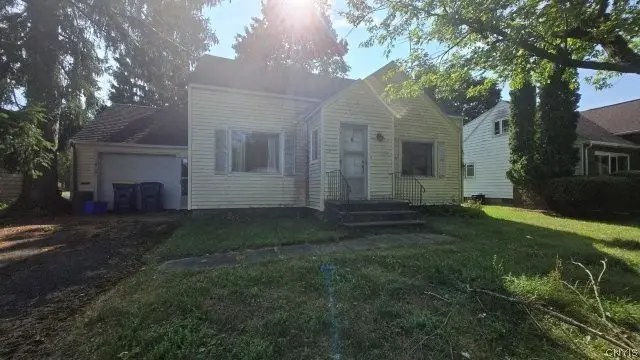
415 Meadow Rd · Westvale, NY
Flood risk 1/10 · Minimal
- FEMA flood zone
- X (unshaded)
- Chance of flooding over 30 yrs
- 0.0%
- Est. flood insurance / yr
- $473 – $860
Fire risk 1/10 · Minimal
- Est. fire insurance / yr
- $691 – $1,283
Heat risk 3/10 · Minor
- Hot days now (above 95°F)
- 7 days/yr
- Hot days in 30 yrs
- 16 days/yr
Wind risk 1/10 · Minimal
- Chance of severe wind over 30 yrs
- 1.0%
Air-quality risk 2/10 · Minimal
- Unhealthy air days now
- 0 days/yr
- Unhealthy air days in 30 yrs
- 1 days/yr
Risk factors via First Street. Map © Google.
Why this score? — see what drove the B- grade
The composite is a weighted blend of 9 inputs, each scored 0–100. Each bar is that input's sub-score; the figure is the points it added to the 100-point composite (weight × sub-score).
- Cash flow +22.9/30.0
- ARV discount +15.0/15.0
- 1% rule +8.6/10.0
- DSCR +7.3/10.0
- Schools +5.3/10.0
- Livability +4.0/5.0
- Rent growth +2.5/5.0
- Condition / age +2.5/5.0
- Appreciation +0.0/10.0
$139,900
🖨 Deal sheet (PDF) 📄 Offer letter ✓ Due diligence
Listing remarks
3 bed 1 bath cape cod in need of total rehab. Features hardwood floor and dining room. Home will need foundation work and mold removal. No power or water on. Cash or rehab loans needed. * * Home is full of junk * * * * Will not be cleaned out * * * sold as is to settle estate. Bring flashlight and use caution in home. No offers will be reviewed until Monday at 2 pm.
Key facts
- 0.37 acre lot
- Garage
- Built 1950
Property features AI
Exterior
- Parking: Attached garage (1 car)
- Utilities: Electricity connected (circuit breakers); Public water connected; Sewer connected; Cable available
- Home design: Single-story home; Resale fixer condition
- Construction: Vinyl siding; Copper plumbing; Asphalt architectural shingle roof; Block foundation; Existing structure
- Exterior features: Blacktop driveway; Flag lot; Residential lot; City street frontage; Lot dimensions approx. 65 x 248
Interior
- Kitchen: Eat-in kitchen
- Bedrooms: 2 bedrooms on main level
- Flooring: Carpet; Hardwood; Resilient flooring; Varied flooring
- Bathrooms: 1 full bathroom on main level
- Heating & cooling: Gas forced-air heating
- Interior features: Separate/formal dining room; Eat-in kitchen; Separate/formal living room; Bedroom on main level; Full basement
- Laundry & utility: Laundry located in basement; Gas water heater
Neighborhood map
What this means for you Summary
Snapshot
- This is a 3-bed/1.5-bath single-family listed at $140k.
Deal economics
- At list price, monthly cash flow is $245 ($3k/yr) — positive.
- The deal already cash-flows at list — no discount required.
- Meets the 1% rule at list price ($2k rent vs $140k).
- Cap rate 8.4% vs local median 3.9% in Westvale — top-decile yield for the area; either an underpriced asset or a hidden risk that comps aren't pricing in. Stress-test before assuming the spread holds.
Location & tenants
- Location reads 80/100 on livability (#105 in NY, #1,731 nationally) — a professional / high-income tenant draw. Strengths: employment A+, housing A+, health & safety A; Watch: amenities F, commute F.
- Westhill Central School District (suburban): math 57% / reading 64% proficiency, ranked #212 of 590 in NY (top 36%) — acceptable for families but not a draw, mixed tenant base, ~2y average lease; only 11% free/reduced lunch — higher-income household profile.
- Zoned schools: Cherry Road Elementary School (math 65% / reading 72%, grade B+, #517 of 2,108 statewide, top 25%, 365 students, 32% FRL); Onondaga Hill Middle School (math 39% / reading 60%, grade C, #280 of 729 statewide, top 40%, 554 students, 32% FRL); Westhill High School (math 98% / reading 70%, grade A, #409 of 1,100 statewide, top 39%, 550 students, 25% FRL) — zoned schools average 29% FRL vs 11% district-wide (18 pts higher); higher-poverty schools than district average — tighter screening recommended.
- Market conditions: 53 active listings in the ZIP; 3 comparable units currently listed for rent nearby; rentals at typical pace (median 16d on market — plan ~3-4 weeks tenant-placement turnaround); solid renter incomes; 616 units permitted in Onondaga County in 2024 (256 in 5+ unit buildings).
Forward outlook
- Local home prices are declining (-3.0%/yr); year-one equity from $967 of loan paydown is wiped out by about $4k of value loss. Plan a longer hold.
- Onondaga County population projected to shrink 9% by 2050 — rents likely to lag national; underwrite the cash flow, not the appreciation.
Negotiation context
- Only 2 days on market — expect competitive offers; lowballing is unlikely to land.
Risks & watch-outs
- Watch-outs: property tax is 4.0% of price; built in 1950 — expect roof / HVAC / electrical / plumbing capex.
Questions for the listing agent
- Built in 1950 — when were the roof, HVAC, electrical panel, plumbing, and water heater last replaced?
- Property tax is high relative to price — has the assessment been appealed recently, and will the sale trigger a re-assessment?
- Is there a deadline driving the sale (1031 exchange, divorce, estate, relocation)? That informs how much negotiation room exists.
- Schools are A-rated — typically a magnet for longer-tenancy family renters. What's the average tenant stay here, and is there a school-zone premium baked into asking?
- What's the average days-on-market for RENTAL listings here right now (not sales)? A rising rental-DOM trend means longer vacancies and softer asking-rent achievability than the comps imply.
- What's the recent tenant-quality profile in this submarket — average credit score on applications, eviction rate, late-payment / NSF rate, and stable-employment percentage? A property-management company in the area should have these aggregated.
- How much new for-sale + rental construction is in the pipeline within 1–3 miles? Heavy new supply typically softens prices + rents 12–24 months out; constrained supply supports both.
Investment metrics
- 1% rule
- 1.36% ✓
- Cap rate
- 8.39%
- Cash-on-cash
- 7.50%
- DSCR
- 1.33
- GRM
- 6.1
CMA / ARV
- ARV (on-the-fly)
- $266,168
- Comps found
- 12
Show comp detail 12 sales within ~0.75 mi
| Address | Dist | Beds/Ba | Sqft | Sold | Price | $/sf | Match |
|---|---|---|---|---|---|---|---|
| 206 Haywood Rd | 0.25mi | 3/1.5 | 1,256 (-8%) | 1mo | $345,000 | $275 | 75 |
| 218 S Terry Rd | 0.35mi | 3/2.0 | 1,308 (-4%) | 8mo | $252,000 | $193 | 69 |
| 420 Newcastle Rd | 0.30mi | 3/2.0 | 1,455 (+7%) | 8mo | $255,000 | $175 | 66 |
| 515 Walberta Rd | 0.33mi | 3/2.0 | 1,478 (+9%) | 9mo | $236,000 | $160 | 60 |
| 603 Fern Rd | 0.37mi | 4/1.0 (+1) | 1,260 (-7%) | 8mo | $212,000 | $168 | 58 |
| 103 Ronnell Dr | 0.46mi | 3/2.0 | 1,237 (-9%) | 7mo | $260,000 | $210 | 56 |
| 500 Walberta Rd | 0.36mi | 4/1.5 (+1) | 1,240 (-9%) | 10mo | $260,000 | $210 | 56 |
| 202 Windemere Rd | 0.54mi | 3/1.0 | 1,224 (-10%) | 4mo | $235,000 | $192 | 53 |
| 215 Newcastle Rd | 0.38mi | 4/2.0 (+1) | 1,493 (+10%) | 9mo | $257,000 | $172 | 52 |
| 113 Spruce Tree Ln | 0.70mi | 3/2.0 | 1,276 (-6%) | 6mo | $250,000 | $196 | 50 |
| 122 Century Dr | 0.71mi | 4/2.5 (+1) | 1,404 (+3%) | 3mo | $285,000 | $203 | 50 |
| 113 Farnham Rd | 0.49mi | 4/2.0 (+1) | 1,559 (+15%) | 7mo | $305,000 | $196 | 40 |
Match score weights: distance 35% · size 25% · config 20% · recency 20%. Top-matched comps best support the ARV.
Projected returns pro-forma
-3.0% appreciation · 3.0% rent growth · sell at horizon
- IRR
- -4.7%
- Equity multiple
- 0.82×
- Total profit
- $-6,872
- Equity at exit
- $20,860
- IRR
- 5.1%
- Equity multiple
- 1.38×
- Total profit
- $14,932
- Equity at exit
- $12,096
Cash invested: $39,172 (down + closing). Projections, not guarantees.
Landlord ↔ Tenant lean methodology
- Overall (STATE)
- 15 Strongly Tenant-Friendly
- State New York
- 15 Strongly Tenant-Friendly · D+10
- County
- — inherits STATE
- City
- — inherits STATE
ZIP-level market 13219
- Home prices YoY
- -20.6%
- Active inventory
- 53
- Price-to-rent
- 6.1×
Monthly cashflow live
- Estimated rent
- $1,900 medium interval (Pro) →
- Mortgage (P&I)
- −$734
- Tax from tax record
- −$465 /mo · $5,574/yr
- Insurance
- −$58
- HOA
- −$0
- Lot rent
- −$0
- Vacancy / Maint / Mgmt
- −$399
- Net cashflow
- $245
Break-even live
Sensitivity live
| Price | -10% $324 | -5% $284 | +0% $245 | +5% $205 | +10% $166 |
|---|---|---|---|---|---|
| Rent | -10% $95 | -5% $170 | +0% $245 | +5% $320 | +10% $395 |
| Rate | -1.0pp $315 | -0.5pp $280 | base $245 | +0.5pp $209 | +1.0pp $172 |
UW: 25.0% down · 7.5% · 30yr · 1.5% tax · 5.0% vac · 8.0% maint · 8.0% mgmt
Financing live
Cash to close
- Down payment
- $34,975
- Closing costs
- $4,197
- Reserves months
- —
- Total cash needed
- —
Loan-product check · same deal, 3 products live
Conventional
25% down · 7.5% · 30yr
- Down + closing
- —
- Monthly P&I
- —
- Monthly cashflow
- —
- DSCR
- —
- Eligible?
- —
Personal DTI + credit; lowest rate.
DSCR
20% down · 8.5% · 30yr
- Down + closing
- —
- Monthly P&I
- —
- Monthly cashflow
- —
- DSCR
- —
- Eligible?
- —
No personal income docs; deal must DSCR.
Hard money
10% down · 12.0% · 12mo
- Down + closing
- —
- Monthly P&I
- —
- Monthly cashflow
- —
- DSCR
- —
- Eligible?
- —
Short-term bridge; refi at stabilization.
Rent comps 3 comps
| Address | Beds | Baths | Sqft | Rent | $/sqft | DOM | Units | Dist |
|---|---|---|---|---|---|---|---|---|
| 4300 Fay Rd Syracuse, NY | 2.0 | 2.0 | 1217 | $2,200 | $1.81 | 16d | 1 | 0.78mi |
| 306 Hall Ave Unit Left Side Solvay, NY | 3.0 | 1.5 | 1120 | $1,750 | $1.56 | 46d | 1 | 1.48mi |
| 410 Chemung St Unit 1 Syracuse, NY | 3.0 | 1.0 | 1100 | $1,500 | $1.36 | 16d | 1 | 1.49mi |
Listing history 4 events
-
2026-06-15status $139,900 Pending 2 DOM
-
2026-06-15days on market $139,900 Active 2 DOM
-
2026-06-14remarks 377-char remark
-
2026-06-14$139,900 Active 1 DOM
ⓘ Source: listings_history table (triggers on properties + properties_extension) + one-shot
backfill from property_details.listing_events for pre-trigger history.
Tax reassessment forecast NY · Partial reset (capped growth)
- Current annual tax
- $5,574 · $465/mo
- Projected year-2 tax
- $5,574 · $465/mo
- Expected delta
- $0/yr ($0/mo · 0.0%)
ⓘ Screening estimate from a state-policy table — verify with the county assessor before closing.
Climate risk First Street
- Flood 1/10 Low FEMA zone X (unshaded) · 0% chance over 30 yrs
- Wildfire 1/10 Low
- Heat 3/10 Moderate 7 d/yr ≥95°F today · 16 d/yr by 30 yrs out
- Wind 1/10 Low 100% chance of damaging wind over 30 yrs
- Air quality 2/10 Low 0 unhealthy d/yr today · 1 by 30 yrs out
Nearby sold comps map
Loading sold comps map…
Walkable amenities ~0.75 mi
Loading nearby amenities…
Taxation est. · year 1
- Rental income
- $22,804
- − Mortgage interest
- −$7,837
- − Property taxes
- −$5,574
- − Insurance
- −$700
- − Repairs & maintenance
- −$1,824
- − Management
- −$1,824
- − Depreciation
- −$4,070
- Taxable income
- $975
- Est. tax owed @ 24.0%
- −$234
- After-tax cash flow
- $2,704/yr
For passive investors: Depreciation is non-cash, so a rental often shows a tax loss while cash-flowing — sheltering income. Rental losses are passive: they offset passive income freely, and up to $25,000/yr can offset ordinary (W-2) income if you actively participate and your MAGI is under $100k (phasing out to $0 by $150k); unused losses carry forward. On sale, claimed depreciation is recaptured at up to 25%, and gains may owe capital-gains tax (a 1031 exchange can defer both). Figures are a year-1 estimate at your 24.0% rate — not tax advice; consult a CPA.
Schools (NCES district)
- District
- Westhill Central School District
- NCES district ID
- 3607320
- Math proficiency
- 57% ▼ -10.00%
- Reading proficiency
- 64% ▲ 9.00%
- Median HH income
- $66,976
- Composite
- 53.09/100
- National rank
- #1516
- State rank
- #212 of 590 in NY
Livability — Westvale
- Score
- 80/100
- State rank
- #105
- US rank
- #1731
Category grades
Schools grade is shown separately in the Schools card above.
Census & demographics
- Census place
- Westvale, NY
- County
- Onondaga County · 247,257 people
- City population
- 15,546
- Metro
- Syracuse, NY
- Population (ZIP)
- 14,744
- Household income
- $85,149
- Rent vs Own
- Severe rent burden
- 222.0
Population outlook (Onondaga County) Hauer SSP2
- Today (2025)
- 467,894 people
- By 2030
- 463,381 · -1.0%
- By 2040
- 447,697 · -4.3%
- By 2050
- 426,399 · -8.9%
- By 2075
- 373,661 · -20.1%
- By 2100
- 307,967 · -34.2%
Race, ethnicity, and origin ACS 2023
- Neighborhood character
- Predominantly White (87%)
- Race & ethnicity
- White 87% Two or more races 5% Hispanic / Latino 5% Black 4% Asian 1%
- Common ancestry
- Romanian 8% Lithuanian 4% Subsaharan African 3%
- Foreign-born
- 7% · Canada
- Languages at home
- 91% English-only · Russian/Polish/Slavic 3% Spanish 2% Arabic 1%
Political lean MEDSL · Onondaga
- 2024 margin
- D (+17.3) · D 58.6% · R 41.4%
- 2008→2024 swing
- -3.0pp toward R · 2008: 20.3pp · 2024: 17.3pp
- All cycles
- 2024: D+17.3 2020: D+20.6 2016: D+12.8 2012: D+21.1 2008: D+20.3
Not yet ingested
- Civics
- —
Market trends
- HPI YoY
- ▼ -77.80%
- Current HPI
- 300.7211
- Rent YoY
- —
- Metro
- Syracuse, NY
- State GDP YoY
- ▲ 2.60%
- F500 in state
- 92
Industry mix (Fortune 500 HQ in NY)
| Industry | F500 HQs | Revenue |
|---|---|---|
| Financial Services | 10 | $950B |
|
||
| Consumer Goods | 9 | $162B |
|
||
| Insurance | 4 | $225B |
|
||
| Telecommunications | 2 | $144B |
|
||
| Pharmaceuticals | 2 | $112B |
|
||
| Media / Entertainment | 2 | $69B |
|
||
Price history
1 event — show timeline
- 2026-06-12 Listed $139,900 CNYIS
Property tax history
+12.3%/yrLatest (2025): $5,574 · +4.3% YoY. Source: county tax records.
Cash-flow waterfall
monthlySold comps — $/sqft
last 12 mo · ≤1 miLoading sold comps…