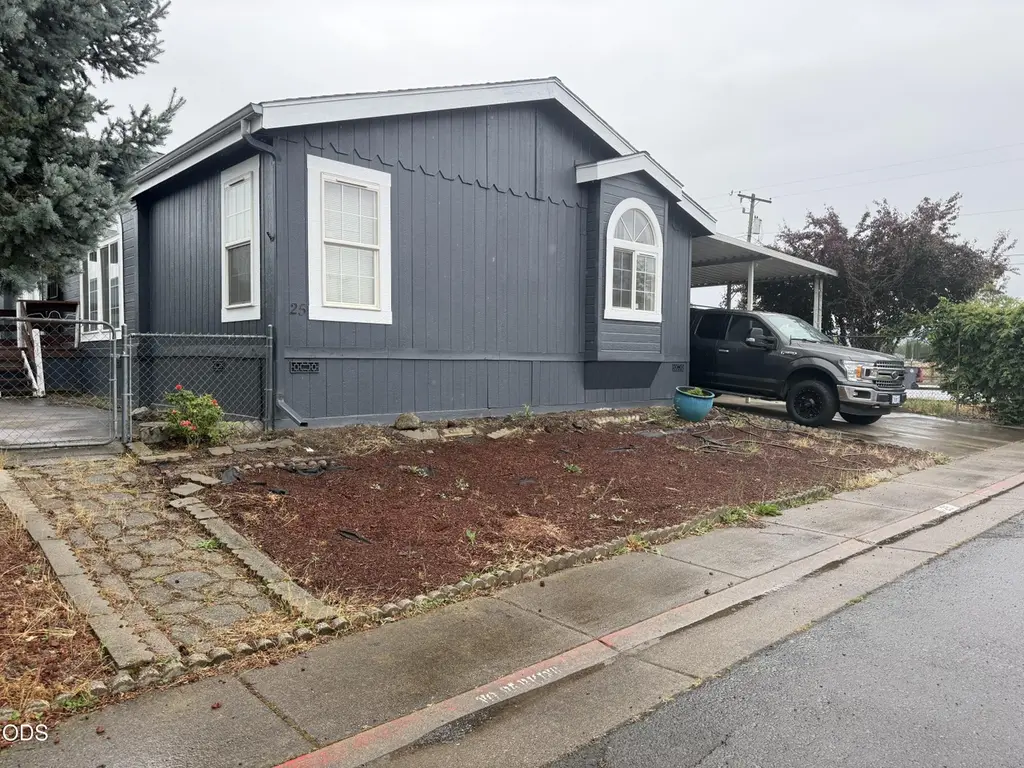
3750 Avenue G Spc 25
White City, OR 97503
$108,000B-
3 bd · 1.0 ba ·
1,716 sqft ·
Built 1995
· Land
· Active
· 13 DOM
Cashflow @ list (25.0% down · 7.5%)
Estimated rent
$1,735/mo
Mortgage (P&I)
−$566
Tax + insurance
−$133
HOA
−$0
Vac / Maint / Mgmt
−$364
Net cashflow
$671/mo
Annual
$8,056/yr
Cap rate
13.75%
Cash-on-cash
26.64%
DSCR
2.19
1% rule
1.61%
Cash to close
$30,240
Investor read
- This is a 3-bed/1.0-bath land listed at $108k.
- At list price, monthly cash flow is $671 ($8k/yr) — positive.
- The deal already cash-flows at list — no discount required.
- Meets the 1% rule at list price ($2k rent vs $108k).
- Only 13 days on market — expect competitive offers; lowballing is unlikely to land.
- Local home prices are declining (-3.0%/yr); year-one equity from $747 of loan paydown is wiped out by about $3k of value loss. Plan a longer hold.
- Location reads 67/100 on livability (#182 in OR) — a middle-class / working-renter tenant base. Strengths: housing A+, health & safety A+, cost of living A; Watch: employment C-, crime D-, amenities F.
- Eagle Point SD 9 (suburban): math 26% / reading 45% proficiency, ranked #134 of 183 in OR (top 73%) — families likely to look elsewhere, expect single-tenant / working-renter base with shorter leases.
- Zoned schools: Table Rock Elementary (717 students, 81% FRL); White Mountain Middle School (376 students, 72% FRL); Eagle Point High School (999 students, 72% FRL) — zoned schools average 75% FRL vs 58% district-wide (17 pts higher); higher-poverty schools than district average — tighter screening recommended.
- Market conditions: 104 active listings in the ZIP; 3 comparable units currently listed for rent nearby; rentals at typical pace (median 23d on market — plan ~3-4 weeks tenant-placement turnaround); 904 units permitted in Jackson County in 2024 (212 in 5+ unit buildings).
- Jackson County population projected at +17% by 2050 — long-run rental-demand tailwind backs the buy-and-hold thesis.
- At projected returns (-3.0% appreciation + 3.0% rent growth), your $30k cash investment doubles in ~5 years — after that, you're playing with house money.
- Climate carrying-cost: severe wildfire risk; extreme-heat days projected 7→15/yr by 2055 (HVAC capex compounding) — expect insurance premiums to compound above CPI over the hold.
- Cap rate 13.8% vs local median 3.2% in White City — top-decile yield for the area; either an underpriced asset or a hidden risk that comps aren't pricing in. Stress-test before assuming the spread holds.
Questions for listing agent
- Is there a deadline driving the sale (1031 exchange, divorce, estate, relocation)? That informs how much negotiation room exists.
- Schools are F-rated, which usually means shorter tenancies and higher turnover. Who's the typical renter profile here, and what's been the actual vacancy rate?
- Crime grade is D in this area — have there been break-ins, vandalism, or insurance claims at this property in the last 3 years? What carrier currently insures it and at what premium?
- What's the average days-on-market for RENTAL listings here right now (not sales)? A rising rental-DOM trend means longer vacancies and softer asking-rent achievability than the comps imply.
- What's the recent tenant-quality profile in this submarket — average credit score on applications, eviction rate, late-payment / NSF rate, and stable-employment percentage? A property-management company in the area should have these aggregated.
- How much new for-sale + rental construction is in the pipeline within 1–3 miles? Heavy new supply typically softens prices + rents 12–24 months out; constrained supply supports both.
CashFlowRE · CFR-BJNP7M6VQ2GBJQ
· Data 1 day ago
cashflowre.app · 2026-05-29