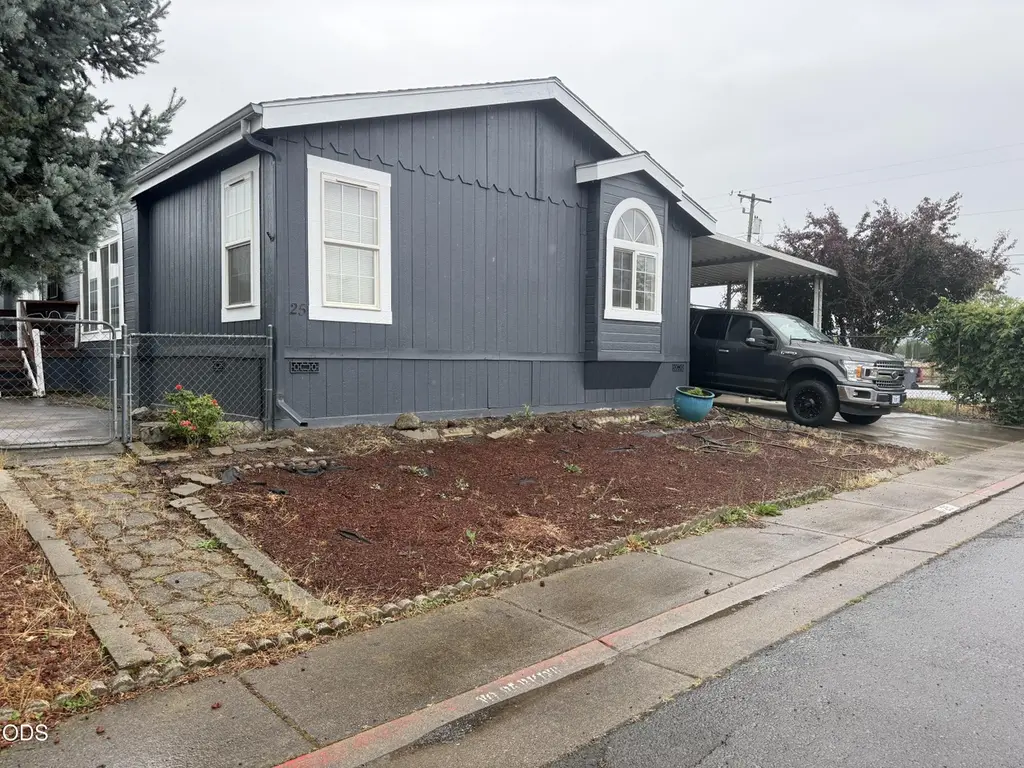
3750 Avenue G Spc 25 · White City, OR
Flood risk 1/10 · Minimal
- FEMA flood zone
- X (unshaded)
- Chance of flooding over 30 yrs
- 0.0%
- Est. flood insurance / yr
- $507 – $1,088
Fire risk 8/10 · Major
- Est. fire insurance / yr
- $498 – $926
Heat risk 6/10 · Moderate
- Hot days now (above 98°F)
- 7 days/yr
- Hot days in 30 yrs
- 15 days/yr
Wind risk 1/10 · Minimal
- Chance of severe wind over 30 yrs
- —
Air-quality risk 10/10 · Severe
- Unhealthy air days now
- 28 days/yr
- Unhealthy air days in 30 yrs
- 30 days/yr
Risk factors via First Street. Map © Google.
Why this score? — see what drove the B- grade
The composite is a weighted blend of 9 inputs, each scored 0–100. Each bar is that input's sub-score; the figure is the points it added to the 100-point composite (weight × sub-score).
- Cash flow +30.0/30.0
- 1% rule +10.0/10.0
- DSCR +10.0/10.0
- ARV discount +7.5/15.0
- Livability +3.4/5.0
- Schools +3.3/10.0
- Rent growth +2.5/5.0
- Condition / age +2.5/5.0
- Appreciation +0.0/10.0
$108,000
🖨 Deal sheet (PDF) 📄 Offer letter ✓ Due diligence
Listing remarks
Spacious and well-maintained home located in an all-ages park in desirable White City! Situated on a large lot, this property offers exceptional outdoor living with two covered decks, a turf pet area, and two storage sheds for added flexibility and convenience. Inside, you'll find numerous updates throughout along with fresh exterior paint that adds to the home's curb appeal. Pride of ownership is evident, making this move-in ready home a standout opportunity. Newer roof, exterior paint and recent primary bathroom remodel. Comfortable, functional, and inviting--this is a must-tour property you won't want to miss!
Key facts
- Parking
- Built 1995
- Listed 13 days
Property features AI
Finance
- Other: Flood zone unknown
- Financial info: Monthly land lease of 545
- HOA & community: Community offers gas availability, park and playground; CCRs apply
Exterior
- Parking: Asphalt driveway, no garage
- Security: Carbon monoxide detector(s); Smoke detector(s)
- Utilities: Public water; Public sewer; Electricity connected
- Home design: Mobile home (double wide) located in a park; Single-level; Built in 1995; May remain in park; Wood skirting; Manufacturer: Skyline
- Construction: Block foundation
- Exterior features: Composition roof; Vinyl window frames; Shed(s); Level lot; Paved road; Shared access road frontage; Easements for access and utilities
Interior
- Kitchen: Dishwasher; Microwave; Oven; Range; Range hood; Refrigerator; Water heater
- Bedrooms: 3 bedrooms (primary bedroom included)
- Flooring: Carpet; Laminate; Tile; Vinyl
- Bathrooms: 2 full bathrooms
- Heating & cooling: Heat pump heating; Central air conditioning (heat pump); Has heating and cooling
- Interior features: Built-in features; Ceiling fan(s); Kitchen island; Laminate counters; Pantry; Shower/tub combo
- Laundry & utility: Laundry room
Neighborhood map
What this means for you Summary
Snapshot
- This is a 3-bed/1.0-bath land listed at $108k.
Deal economics
- At list price, monthly cash flow is $671 ($8k/yr) — positive.
- The deal already cash-flows at list — no discount required.
- Meets the 1% rule at list price ($2k rent vs $108k).
- Cap rate 13.8% vs local median 3.2% in White City — top-decile yield for the area; either an underpriced asset or a hidden risk that comps aren't pricing in. Stress-test before assuming the spread holds.
Location & tenants
- Location reads 67/100 on livability (#182 in OR) — a middle-class / working-renter tenant base. Strengths: housing A+, health & safety A+, cost of living A; Watch: employment C-, crime D-, amenities F.
- Eagle Point SD 9 (suburban): math 26% / reading 45% proficiency, ranked #134 of 183 in OR (top 73%) — families likely to look elsewhere, expect single-tenant / working-renter base with shorter leases.
- Zoned schools: Table Rock Elementary (717 students, 81% FRL); White Mountain Middle School (376 students, 72% FRL); Eagle Point High School (999 students, 72% FRL) — zoned schools average 75% FRL vs 58% district-wide (17 pts higher); higher-poverty schools than district average — tighter screening recommended.
- Market conditions: 104 active listings in the ZIP; 3 comparable units currently listed for rent nearby; rentals at typical pace (median 23d on market — plan ~3-4 weeks tenant-placement turnaround); 904 units permitted in Jackson County in 2024 (212 in 5+ unit buildings).
Forward outlook
- Local home prices are declining (-3.0%/yr); year-one equity from $747 of loan paydown is wiped out by about $3k of value loss. Plan a longer hold.
- Jackson County population projected at +17% by 2050 — long-run rental-demand tailwind backs the buy-and-hold thesis.
- At projected returns (-3.0% appreciation + 3.0% rent growth), your $30k cash investment doubles in ~5 years — after that, you're playing with house money.
Negotiation context
- Only 13 days on market — expect competitive offers; lowballing is unlikely to land.
Risks & watch-outs
- Climate carrying-cost: severe wildfire risk; extreme-heat days projected 7→15/yr by 2055 (HVAC capex compounding) — expect insurance premiums to compound above CPI over the hold.
Questions for the listing agent
- Is there a deadline driving the sale (1031 exchange, divorce, estate, relocation)? That informs how much negotiation room exists.
- Schools are F-rated, which usually means shorter tenancies and higher turnover. Who's the typical renter profile here, and what's been the actual vacancy rate?
- Crime grade is D in this area — have there been break-ins, vandalism, or insurance claims at this property in the last 3 years? What carrier currently insures it and at what premium?
- What's the average days-on-market for RENTAL listings here right now (not sales)? A rising rental-DOM trend means longer vacancies and softer asking-rent achievability than the comps imply.
- What's the recent tenant-quality profile in this submarket — average credit score on applications, eviction rate, late-payment / NSF rate, and stable-employment percentage? A property-management company in the area should have these aggregated.
- How much new for-sale + rental construction is in the pipeline within 1–3 miles? Heavy new supply typically softens prices + rents 12–24 months out; constrained supply supports both.
Investment metrics
- 1% rule
- 1.61% ✓
- Cap rate
- 13.75%
- Cash-on-cash
- 26.64%
- DSCR
- 2.19
- GRM
- 5.2
CMA / ARV
No comps found within radius.
Projected returns pro-forma
-3.0% appreciation · 3.0% rent growth · sell at horizon
- IRR
- 20.5%
- Equity multiple
- 1.84×
- Total profit
- $25,252
- Equity at exit
- $16,103
- IRR
- 28.7%
- Equity multiple
- 3.55×
- Total profit
- $77,034
- Equity at exit
- $9,338
Cash invested: $30,240 (down + closing). Projections, not guarantees.
Landlord ↔ Tenant lean methodology
- Overall (STATE)
- 28 Tenant-Leaning
- State Oregon
- 28 Tenant-Leaning · D+6
- County
- — inherits STATE
- City
- — inherits STATE
ZIP-level market 97503
- Home prices YoY
- -28.5%
- Active inventory
- 104
- Price-to-rent
- 5.2×
Monthly cashflow live
- Estimated rent
- $1,735 medium interval (Pro) →
- Mortgage (P&I)
- −$566
- Tax from tax record
- −$88 /mo · $1,060/yr
- Insurance
- −$45
- HOA
- −$0
- Vacancy / Maint / Mgmt
- −$364
- Net cashflow
- $671
Break-even live
Sensitivity live
| Price | -10% $732 | -5% $702 | +0% $671 | +5% $641 | +10% $610 |
|---|---|---|---|---|---|
| Rent | -10% $534 | -5% $603 | +0% $671 | +5% $740 | +10% $808 |
| Rate | -1.0pp $726 | -0.5pp $699 | base $671 | +0.5pp $643 | +1.0pp $615 |
UW: 25.0% down · 7.5% · 30yr · 1.5% tax · 5.0% vac · 8.0% maint · 8.0% mgmt
Financing live
Cash to close
- Down payment
- $27,000
- Closing costs
- $3,240
- Reserves months
- —
- Total cash needed
- —
Loan-product check · same deal, 3 products live
Conventional
25% down · 7.5% · 30yr
- Down + closing
- —
- Monthly P&I
- —
- Monthly cashflow
- —
- DSCR
- —
- Eligible?
- —
Personal DTI + credit; lowest rate.
DSCR
20% down · 8.5% · 30yr
- Down + closing
- —
- Monthly P&I
- —
- Monthly cashflow
- —
- DSCR
- —
- Eligible?
- —
No personal income docs; deal must DSCR.
Hard money
10% down · 12.0% · 12mo
- Down + closing
- —
- Monthly P&I
- —
- Monthly cashflow
- —
- DSCR
- —
- Eligible?
- —
Short-term bridge; refi at stabilization.
Rent comps 3 comps
| Address | Beds | Baths | Sqft | Rent | $/sqft | DOM | Units | Dist |
|---|---|---|---|---|---|---|---|---|
| 7830 Jacqueline Way White City, OR | 3.0 | 2.5 | 1355 | $1,700 | $1.25 | 45d | 1 | 0.36mi |
| 7673 24th St Unit 7673 White City, OR | 3.0 | 2.0 | 1200 | $1,695 | $1.41 | 23d | 1 | 0.65mi |
| 3936 Francine Ct White City, OR | 3.0 | 2.0 | 1200 | $1,875 | $1.56 | 23d | 1 | 0.80mi |
Listing history 11 events
-
2026-06-21days on market $108,000 Active 13 DOM
-
2026-06-19days on market $108,000 Active 11 DOM
-
2026-06-18days on market $108,000 Active 10 DOM
-
2026-06-17days on market $108,000 Active 9 DOM
-
2026-06-16days on market $108,000 Active 8 DOM
-
2026-06-15days on market $108,000 Active 7 DOM
-
2026-06-14days on market $108,000 Active 5 DOM
-
2026-06-13days on market $108,000 Active 4 DOM
-
2026-06-10days on market $108,000 Active 2 DOM
-
2026-06-09remarks 620-char remark
-
2026-06-09$108,000 Active 1 DOM
ⓘ Source: listings_history table (triggers on properties + properties_extension) + one-shot
backfill from property_details.listing_events for pre-trigger history.
Tax reassessment forecast OR · Resets to sale price
- Current annual tax
- $1,060 · $88/mo
- Projected year-2 tax
- $1,060 · $88/mo
- Expected delta
- $0/yr ($0/mo · 0.0%)
ⓘ Screening estimate from a state-policy table — verify with the county assessor before closing.
Climate risk First Street
- Flood 1/10 Low FEMA zone X (unshaded) · 0% chance over 30 yrs
- Wildfire 8/10 Severe
- Heat 6/10 Major 7 d/yr ≥98°F today · 15 d/yr by 30 yrs out
- Wind 1/10 Low
- Air quality 10/10 Extreme 28 unhealthy d/yr today · 30 by 30 yrs out
Nearby sold comps map
Loading sold comps map…
Walkable amenities ~0.75 mi
Loading nearby amenities…
Taxation est. · year 1
- Rental income
- $20,825
- − Mortgage interest
- −$6,050
- − Property taxes
- −$1,060
- − Insurance
- −$540
- − Repairs & maintenance
- −$1,666
- − Management
- −$1,666
- − Depreciation
- −$3,142
- Taxable income
- $6,702
- Est. tax owed @ 24.0%
- −$1,608
- After-tax cash flow
- $6,447/yr
For passive investors: Depreciation is non-cash, so a rental often shows a tax loss while cash-flowing — sheltering income. Rental losses are passive: they offset passive income freely, and up to $25,000/yr can offset ordinary (W-2) income if you actively participate and your MAGI is under $100k (phasing out to $0 by $150k); unused losses carry forward. On sale, claimed depreciation is recaptured at up to 25%, and gains may owe capital-gains tax (a 1031 exchange can defer both). Figures are a year-1 estimate at your 24.0% rate — not tax advice; consult a CPA.
Schools (NCES district)
- District
- Eagle Point SD 9
- NCES district ID
- 4104500
- Math proficiency
- 26% ▬ 0.00%
- Reading proficiency
- 45% ▬ 0.00%
- Median HH income
- $47,834
- Composite
- 33.13/100
- National rank
- #10630
- State rank
- #134 of 183 in OR
Livability — White City
- Score
- 67/100
- State rank
- #182
- US rank
- #11152
Category grades
Schools grade is shown separately in the Schools card above.
Census & demographics
- Census place
- White City, OR
- Population (ZIP)
- 14,119
Population outlook (Jackson County) Hauer SSP2
- Today (2025)
- 234,433 people
- By 2030
- 243,834 · +4.0%
- By 2040
- 259,717 · +10.8%
- By 2050
- 273,269 · +16.6%
- By 2075
- 300,624 · +28.2%
- By 2100
- 305,256 · +30.2%
Race, ethnicity, and origin ACS 2023
- Neighborhood character
- Majority White (58%)
- Race & ethnicity
- White 58% Hispanic / Latino 35% Two or more races 11% Asian 1%
- Hispanic origin (detail)
- Mexican 34%
- Common ancestry
- Slovak 4% Italian 3% Portuguese 2%
- Foreign-born
- 11% · Canada
- Languages at home
- 77% English-only · Spanish 22% Tagalog/Filipino 1%
Political lean MEDSL · Jackson
- 2024 margin
- Lean R (+6.4) · D 45.5% · R 51.9% · Other 2.6%
- 2008→2024 swing
- -6.5pp toward R · 2008: 0.1pp · 2024: -6.4pp
- All cycles
- 2024: R+6.4 2020: R+3.5 2016: R+9.2 2012: R+5.0 2008: D+0.1
Not yet ingested
- Civics
- —
Market trends
- HPI YoY
- ▼ -106.87%
- Current HPI
- 268.6998
- Rent YoY
- —
- Metro
- —
- State GDP YoY
- ▲ 2.05%
- F500 in state
- 2
Industry mix (Fortune 500 HQ in OR)
| Industry | F500 HQs | Revenue |
|---|---|---|
| Consumer Goods | 1 | $51B |
|
||
Price history
+0.0% since first listed2 events — show timeline
- 2026-06-08 Listed $108,000 MLSCO
- 2026-06-08 Price Changed $108,000 MLSCO
Property tax history
+8.9%/yrLatest (2022): $1,060 · +7.4% YoY. Source: county tax records.
Cash-flow waterfall
monthlySold comps — $/sqft
last 12 mo · ≤1 miLoading sold comps…