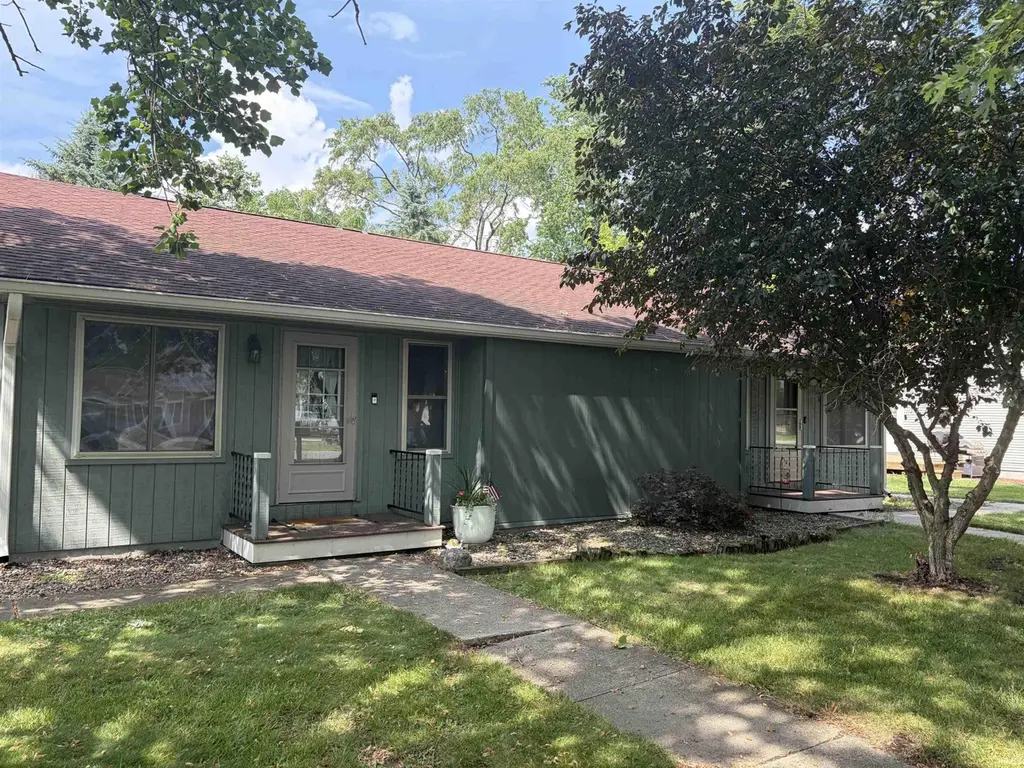
506 Foster St
Monticello, IN 47960
$219,900D+
4 bd · 2.0 ba ·
1,664 sqft ·
Built 1984
· MultiFamily
· Active
· 11 DOM
Cashflow @ list (25.0% down · 7.5%)
Estimated rent
$2,203/mo
Mortgage (P&I)
−$1,153
Tax + insurance
−$366
HOA
−$0
Vac / Maint / Mgmt
−$463
Net cashflow
$221/mo
Annual
$2,648/yr
Cap rate
7.50%
Cash-on-cash
4.30%
DSCR
1.19
1% rule
1.00%
Cash to close
$61,572
Investor read
- This is a 2 × 2-bed/1.0-bath units multifamily listed at $220k. Condition is rated average.
- At list price, monthly cash flow is $221 ($3k/yr) — positive. Per door: $110/mo.
- The deal already cash-flows at list — no discount required.
- Meets the 1% rule at list price ($2k rent vs $220k).
- Only 11 days on market — expect competitive offers; lowballing is unlikely to land.
- Local home prices are declining (-3.0%/yr); year-one equity from $2k of loan paydown is wiped out by about $7k of value loss. Plan a longer hold.
- Location reads 71/100 on livability (#141 in IN) — a middle-class / working-renter tenant base. Strengths: cost of living A+, housing A+, health & safety A+; Watch: amenities F, commute F, employment F.
- Twin Lakes School Corporation (town): math 39% / reading 46% proficiency, ranked #116 of 301 in IN (top 38%) — families likely to look elsewhere, expect single-tenant / working-renter base with shorter leases.
- Zoned schools: Meadowlawn Elementary School (math 36% / reading 37%, grade F, #571 of 994 statewide, top 58%, 567 students, 56% FRL); Roosevelt Middle School (math 38% / reading 47%, grade D-, #98 of 330 statewide, top 30%, 523 students, 67% FRL); Twin Lakes Senior High School (math 37% / reading 62%, grade D, #123 of 369 statewide, top 36%, 674 students, 59% FRL) — zoned schools average 60% FRL vs 41% district-wide (20 pts higher); higher-poverty schools than district average — tighter screening recommended.
- Market conditions: 224 active listings in the ZIP; 1 comparable units currently listed for rent nearby; 47 units permitted in White County in 2024 (0 in 5+ unit buildings).
- White County population projected at -19% by 2050 — secular population decline; favor cash flow + early exit over multi-decade hold.
- Cap rate 7.5% vs local median 3.4% in Monticello — top-decile yield for the area; either an underpriced asset or a hidden risk that comps aren't pricing in. Stress-test before assuming the spread holds.
Questions for listing agent
- Can we see the unit-by-unit rent roll, current vacancy, and any below-market leases? What's the average tenancy length?
- What capital expenditures (roof, boiler, parking lot, exteriors) have been made in the last 5 years, and what's planned in the next 2?
- Is there a deadline driving the sale (1031 exchange, divorce, estate, relocation)? That informs how much negotiation room exists.
- The area grade is low — what's the realistic commute time and amenity access for the typical tenant pool here? Any planned neighborhood developments (good or bad) we should know about?
- What's the average days-on-market for RENTAL listings here right now (not sales)? A rising rental-DOM trend means longer vacancies and softer asking-rent achievability than the comps imply.
- What's the recent tenant-quality profile in this submarket — average credit score on applications, eviction rate, late-payment / NSF rate, and stable-employment percentage? A property-management company in the area should have these aggregated.
- How much new apartment / multifamily construction is in the pipeline within 1–3 miles? Heavy new supply (>2% of stock underway) typically softens rents 12–24 months out; light construction supports rent growth.
Repairs flagged (vision-AI assessment)
- Moderate: kitchen cabinets — Worn and dated appearance
- Moderate: kitchen countertops — Dated appearance
- Moderate: bathroom fixtures — Dated appearance
- Minor: landscaping — Overgrown areas and debris
CashFlowRE · CFR-BJZ7X0AN5R6MX6
· Data 8 h ago
cashflowre.app · 2026-05-29