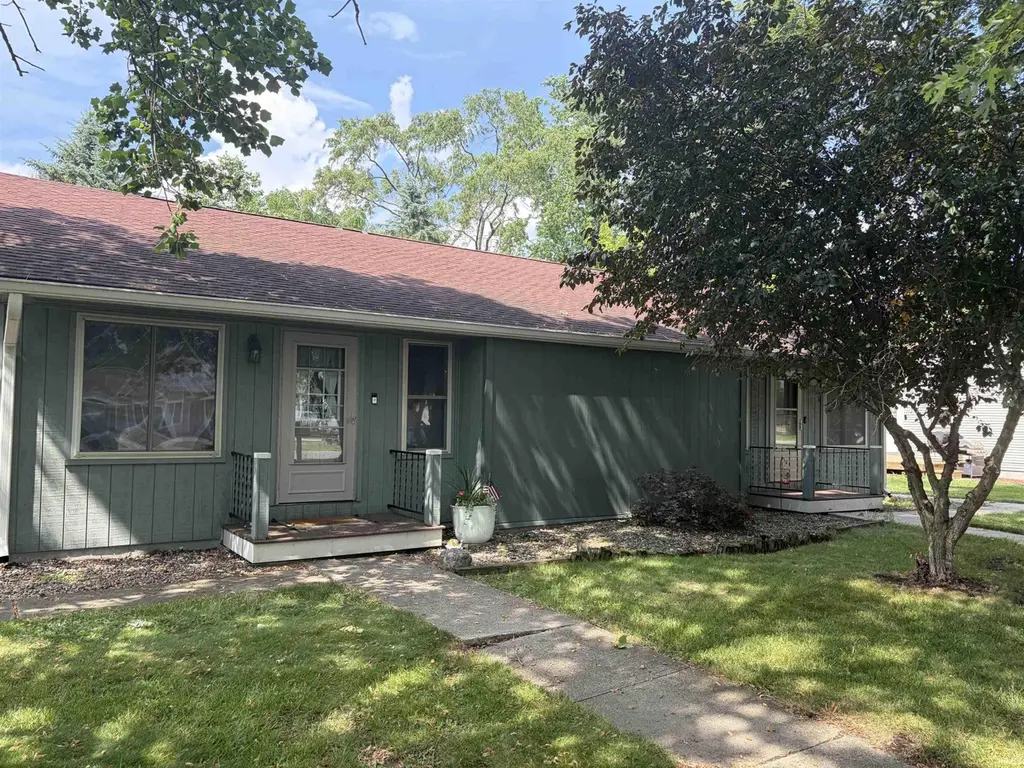
 Duplex
506 Foster St · Monticello, IN
Flood risk 4/10 · Minor
- FEMA flood zone
- X (unshaded)
- Chance of flooding over 30 yrs
- 0.21%
- Est. flood insurance / yr
- $507 – $1,088
Fire risk 1/10 · Minimal
- Est. fire insurance / yr
- $717 – $1,331
Heat risk 3/10 · Minor
- Hot days now (above 102°F)
- 7 days/yr
- Hot days in 30 yrs
- 17 days/yr
Wind risk 2/10 · Minimal
- Chance of severe wind over 30 yrs
- —
Air-quality risk 2/10 · Minimal
- Unhealthy air days now
- 1 days/yr
- Unhealthy air days in 30 yrs
- 2 days/yr
Risk factors via First Street. Map © Google.
Why this score? — see what drove the D+ grade
The composite is a weighted blend of 9 inputs, each scored 0–100. Each bar is that input's sub-score; the figure is the points it added to the 100-point composite (weight × sub-score).
- Cash flow +18.8/30.0
- ARV discount +7.5/15.0
- DSCR +5.9/10.0
- 1% rule +5.0/10.0
- Schools +3.6/10.0
- Livability +3.6/5.0
- Condition / age +2.8/5.0
- Rent growth +2.5/5.0
- Appreciation +0.0/10.0
$219,900
🖨 Deal sheet (PDF) 📄 Offer letter ✓ Due diligence
Multi-family units
County records classify this as Multi-Family (2-4 Unit). Listing-text estimate: 2 units. confirmed
Listing remarks
Well cared for Duplex on West Side of Monticello with excellent proximity to schools, City Parks, town square, downtown retail areas and Wal-Mart. This Duplex has updated a/c units, updated vinyl windows, nice wood decks, updated plank flooring, a utility shed for storage needs.
Key facts
- Proximity to schools
- City parks
- Town square
Tags
Property features AI
Finance
- Other: Pets allowed
Exterior
- Parking: 2 open parking spaces
- Utilities: Public water; Public sewer
- Home design: Residential income property; Duplex
- Construction: Wood siding; Block foundation; Built-up above grade finished area
- Exterior features: Deck; Level lot
Interior
- Kitchen: Range; Refrigerator; Dryer
- Flooring: Carpet; Laminate
- Bathrooms: 2 full bathrooms; 4 main-level bathrooms
- Heating & cooling: Central air conditioning; Forced air heating; Natural gas heating
- Interior features: Washer hookup; Crawl space basement
- Laundry & utility: Washer; Washer hookup; Dryer
Neighborhood map
What this means for you Summary
Snapshot
- This is a 2 × 2-bed/1.0-bath units multifamily listed at $220k. Condition is rated average.
Deal economics
- At list price, monthly cash flow is $221 ($3k/yr) — positive. Per door: $110/mo.
- The deal already cash-flows at list — no discount required.
- Meets the 1% rule at list price ($2k rent vs $220k).
- Cap rate 7.5% vs local median 3.4% in Monticello — top-decile yield for the area; either an underpriced asset or a hidden risk that comps aren't pricing in. Stress-test before assuming the spread holds.
Location & tenants
- Location reads 71/100 on livability (#141 in IN) — a middle-class / working-renter tenant base. Strengths: cost of living A+, housing A+, health & safety A+; Watch: amenities F, commute F, employment F.
- Twin Lakes School Corporation (town): math 39% / reading 46% proficiency, ranked #116 of 301 in IN (top 38%) — families likely to look elsewhere, expect single-tenant / working-renter base with shorter leases.
- Zoned schools: Meadowlawn Elementary School (math 36% / reading 37%, grade F, #571 of 994 statewide, top 58%, 567 students, 56% FRL); Roosevelt Middle School (math 38% / reading 47%, grade D-, #98 of 330 statewide, top 30%, 523 students, 67% FRL); Twin Lakes Senior High School (math 37% / reading 62%, grade D, #123 of 369 statewide, top 36%, 674 students, 59% FRL) — zoned schools average 60% FRL vs 41% district-wide (20 pts higher); higher-poverty schools than district average — tighter screening recommended.
- Market conditions: 224 active listings in the ZIP; 1 comparable units currently listed for rent nearby; 47 units permitted in White County in 2024 (0 in 5+ unit buildings).
Forward outlook
- Local home prices are declining (-3.0%/yr); year-one equity from $2k of loan paydown is wiped out by about $7k of value loss. Plan a longer hold.
- White County population projected at -19% by 2050 — secular population decline; favor cash flow + early exit over multi-decade hold.
Negotiation context
- Only 11 days on market — expect competitive offers; lowballing is unlikely to land.
Questions for the listing agent
- Can we see the unit-by-unit rent roll, current vacancy, and any below-market leases? What's the average tenancy length?
- What capital expenditures (roof, boiler, parking lot, exteriors) have been made in the last 5 years, and what's planned in the next 2?
- Is there a deadline driving the sale (1031 exchange, divorce, estate, relocation)? That informs how much negotiation room exists.
- The area grade is low — what's the realistic commute time and amenity access for the typical tenant pool here? Any planned neighborhood developments (good or bad) we should know about?
- What's the average days-on-market for RENTAL listings here right now (not sales)? A rising rental-DOM trend means longer vacancies and softer asking-rent achievability than the comps imply.
- What's the recent tenant-quality profile in this submarket — average credit score on applications, eviction rate, late-payment / NSF rate, and stable-employment percentage? A property-management company in the area should have these aggregated.
- How much new apartment / multifamily construction is in the pipeline within 1–3 miles? Heavy new supply (>2% of stock underway) typically softens rents 12–24 months out; light construction supports rent growth.
Investment metrics
- 1% rule
- 1.00% ✓
- Cap rate
- 7.50%
- Cash-on-cash
- 4.30%
- DSCR
- 1.19
- GRM
- 8.3
CMA / ARV
No comps found within radius.
Projected returns pro-forma
-3.0% appreciation · 3.0% rent growth · sell at horizon
- IRR
- -9.6%
- Equity multiple
- 0.65×
- Total profit
- $-21,544
- Equity at exit
- $32,788
- IRR
- -0.1%
- Equity multiple
- 0.99×
- Total profit
- $-526
- Equity at exit
- $19,013
Cash invested: $61,572 (down + closing). Projections, not guarantees.
Landlord ↔ Tenant lean methodology
- Overall (STATE)
- 90 Strongly Landlord-Friendly
- State Indiana
- 90 Strongly Landlord-Friendly · R+11
- County
- — inherits STATE
- City
- — inherits STATE
ZIP-level market 47960
- Home prices YoY
- -17.8%
- Active inventory
- 224
- Price-to-rent
- 16.6×
Monthly cashflow live
- Estimated rent
- $2,203 medium interval (Pro) →
- Mortgage (P&I)
- −$1,153
- Tax est. 1.5%
- −$275 /mo · $3,298/yr
- Insurance
- −$92
- HOA
- −$0
- Vacancy / Maint / Mgmt
- −$463
- Net cashflow
- $221
Break-even live
Sensitivity live
| Price | -10% $373 | -5% $297 | +0% $221 | +5% $145 | +10% $69 |
|---|---|---|---|---|---|
| Rent | -10% $47 | -5% $134 | +0% $221 | +5% $308 | +10% $395 |
| Rate | -1.0pp $331 | -0.5pp $277 | base $221 | +0.5pp $164 | +1.0pp $106 |
2-unit breakdown (identical units grouped — click to expand)
| Units | Beds | Baths | Est. rent |
|---|---|---|---|
| 2× units | 2 | 1 | $2,204 |
| #1 | 2 | 1 | $1,102 |
| #2 | 2 | 1 | $1,102 |
| Total (2 units) | $2,203 | ||
UW: 25.0% down · 7.5% · 30yr · 1.5% tax · 5.0% vac · 8.0% maint · 8.0% mgmt
Financing live
Cash to close
- Down payment
- $54,975
- Closing costs
- $6,597
- Reserves months
- —
- Total cash needed
- —
Loan-product check · same deal, 3 products live
Conventional
25% down · 7.5% · 30yr
- Down + closing
- —
- Monthly P&I
- —
- Monthly cashflow
- —
- DSCR
- —
- Eligible?
- —
Personal DTI + credit; lowest rate.
DSCR
20% down · 8.5% · 30yr
- Down + closing
- —
- Monthly P&I
- —
- Monthly cashflow
- —
- DSCR
- —
- Eligible?
- —
No personal income docs; deal must DSCR.
Hard money
10% down · 12.0% · 12mo
- Down + closing
- —
- Monthly P&I
- —
- Monthly cashflow
- —
- DSCR
- —
- Eligible?
- —
Short-term bridge; refi at stabilization.
Rent comps 1 comps
| Address | Beds | Baths | Sqft | Rent | $/sqft | DOM | Units | Dist |
|---|---|---|---|---|---|---|---|---|
| 1101 Foxwood Ct Monticello, IN | 1.0–3.0 | 1.0–2.0 | 969 | $1,183 | $1.22 | 14d | 7 | 0.62mi |
Listing history 9 events
-
2026-06-21days on market $219,900 Active 11 DOM
-
2026-06-21days on market $219,900 Active 10 DOM
-
2026-06-18days on market $219,900 Active 8 DOM
-
2026-06-17days on market $219,900 Active 7 DOM
-
2026-06-16days on market $219,900 Active 6 DOM
-
2026-06-15days on market $219,900 Active 5 DOM
-
2026-06-13days on market $219,900 Active 3 DOM
-
2026-06-12remarks 279-char remark
-
2026-06-12$219,900 Active 2 DOM
ⓘ Source: listings_history table (triggers on properties + properties_extension) + one-shot
backfill from property_details.listing_events for pre-trigger history.
Climate risk First Street
- Flood 4/10 Moderate FEMA zone X (unshaded) · 21% chance over 30 yrs
- Wildfire 1/10 Low
- Heat 3/10 Moderate 7 d/yr ≥102°F today · 17 d/yr by 30 yrs out
- Wind 2/10 Low
- Air quality 2/10 Low 1 unhealthy d/yr today · 2 by 30 yrs out
Nearby sold comps map
Loading sold comps map…
Walkable amenities ~0.75 mi
Loading nearby amenities…
Taxation est. · year 1
- Rental income
- $26,436
- − Mortgage interest
- −$12,318
- − Property taxes
- −$3,298
- − Insurance
- −$1,100
- − Repairs & maintenance
- −$2,115
- − Management
- −$2,115
- − Depreciation
- −$6,397
- Taxable loss
- −$907
- Est. tax savings @ 24.0%
- +$218
- After-tax cash flow
- $2,866/yr
For passive investors: Depreciation is non-cash, so a rental often shows a tax loss while cash-flowing — sheltering income. Rental losses are passive: they offset passive income freely, and up to $25,000/yr can offset ordinary (W-2) income if you actively participate and your MAGI is under $100k (phasing out to $0 by $150k); unused losses carry forward. On sale, claimed depreciation is recaptured at up to 25%, and gains may owe capital-gains tax (a 1031 exchange can defer both). Figures are a year-1 estimate at your 24.0% rate — not tax advice; consult a CPA.
Condition & rehab AI · 12 photos
This two-unit property requires moderate renovations to update the kitchen and bathrooms, and some landscaping improvements. The home is currently in average condition and has good potential for increased value with these updates.
Repairs flagged
- Moderate kitchen cabinets — Worn and dated appearance
- Moderate kitchen countertops — Dated appearance
- Moderate bathroom fixtures — Dated appearance
- Minor landscaping — Overgrown areas and debris
Value-add opportunities
- Both Update kitchen cabinets and countertops — Modernizing the kitchen will appeal to both buyers and renters.
- Both Replace dated bathroom fixtures — Updating the bathrooms will improve the home's overall appeal and functionality.
- Both Landscaping and curb appeal improvements — Aesthetic improvements will enhance the home's curb appeal and attract more potential buyers and renters.
Renovation cost estimate screening
| Repair item | Severity | Est. cost |
|---|---|---|
| kitchen cabinets · Worn and dated appearance | Moderate | $3,000–15,000 |
| kitchen countertops · Dated appearance | Moderate | $3,000–15,000 |
| bathroom fixtures · Dated appearance | Moderate | $3,000–15,000 |
| landscaping · Overgrown areas and debris | Minor | $500–3,000 |
| Total estimated repair cost · 4 items | $9,500–48,000 |
Value-add ROI direction
- Both Update kitchen cabinets and countertops — Modernizing the kitchen will appeal to both buyers and renters. ↑
- Both Replace dated bathroom fixtures — Updating the bathrooms will improve the home's overall appeal and functionality. ↑
- Both Landscaping and curb appeal improvements — Aesthetic improvements will enhance the home's curb appeal and attract more potential buyers and renters. ↑
ⓘ Cost ranges are severity-bucket heuristics (US national rule-of-thumb). Get contractor quotes + a written scope before underwriting a rehab budget.
Schools (NCES district)
- District
- Twin Lakes School Corporation
- NCES district ID
- 1811580
- Math proficiency
- 39% ▼ -10.00%
- Reading proficiency
- 46% ▼ -5.00%
- Median HH income
- $48,963
- Composite
- 36.44/100
- National rank
- #4666
- State rank
- #116 of 301 in IN
Livability — Monticello
- Score
- 71/100
- State rank
- #141
- US rank
- #7278
Category grades
Schools grade is shown separately in the Schools card above.
Census & demographics
- Census place
- Monticello, IN
- Population (ZIP)
- 15,313
Population outlook (White County) Hauer SSP2
- Today (2025)
- 23,006 people
- By 2030
- 22,204 · -3.5%
- By 2040
- 20,441 · -11.1%
- By 2050
- 18,711 · -18.7%
- By 2075
- 14,989 · -34.8%
- By 2100
- 10,896 · -52.6%
Race, ethnicity, and origin ACS 2023
- Neighborhood character
- Predominantly White (92%)
- Race & ethnicity
- White 92% Hispanic / Latino 6% Two or more races 3%
- Hispanic origin (detail)
- Mexican 5%
- Common ancestry
- Romanian 4% Iranian 3% Lithuanian 2%
- Foreign-born
- 4% · Canada
- Languages at home
- 94% English-only · Spanish 4%
Political lean MEDSL · White
- 2024 margin
- Solid R (+45.0) · D 26.4% · R 71.4% · Other 2.2%
- 2008→2024 swing
- -36.7pp toward R · 2008: -8.3pp · 2024: -45.0pp
- All cycles
- 2024: R+45.0 2020: R+44.1 2016: R+42.9 2012: R+23.6 2008: R+8.3
Not yet ingested
- Civics
- —
Market trends
- HPI YoY
- ▼ -52.85%
- Current HPI
- 243.8468
- Rent YoY
- —
- Metro
- —
- State GDP YoY
- ▲ 2.90%
- F500 in state
- 18
Industry mix (Fortune 500 HQ in IN)
| Industry | F500 HQs | Revenue |
|---|---|---|
| Industrial Machinery | 2 | $37B |
|
||
| Healthcare | 1 | $177B |
|
||
| Pharmaceuticals | 1 | $45B |
|
||
| Metals / Steel | 1 | $18B |
|
||
| Agriculture | 1 | $17B |
|
||
| Packaging | 1 | $12B |
|
||
Price history
1 event — show timeline
- 2026-06-08 Listed $219,900 IRMLS
Cash-flow waterfall
monthlySold comps — $/sqft
last 12 mo · ≤1 miLoading sold comps…