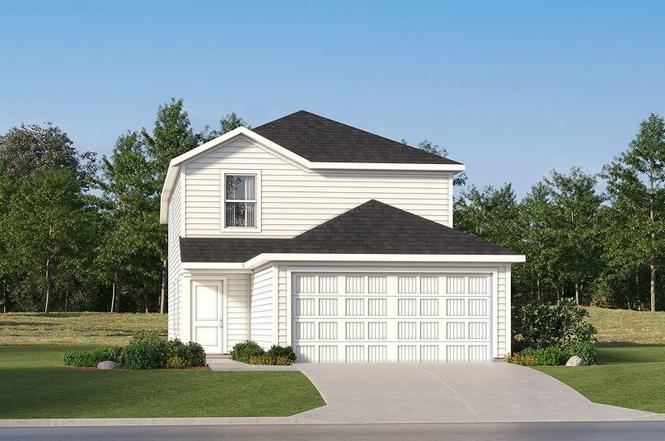
203 Louisa Ln
Jarrell, TX 76537
$215,999D
4 bd · 2.5 ba ·
1,692 sqft ·
Built 2026
· SingleFamily
· Active
· 3 DOM
Cashflow @ list (25.0% down · 7.5%)
Estimated rent
$1,886/mo
Mortgage (P&I)
−$1,133
Tax + insurance
−$360
HOA
−$0
Vac / Maint / Mgmt
−$396
Net cashflow
$-3/mo
Annual
$-37/yr
Cap rate
6.28%
Cash-on-cash
-0.06%
DSCR
1.00
1% rule
0.87%
Cash to close
$60,480
Investor read
- This is a 4-bed/2.5-bath single-family listed at $216k.
- At list price, monthly cash flow is $-3 ($-37/yr) — negative.
- To cash-flow at today's rent, offer at most $216k (0.2% below list).
- To meet the 1% rule (rent ≥ 1% of price), the offer needs to be $189k (12.7% below list).
- Only 3 days on market — expect competitive offers; lowballing is unlikely to land.
- Recommended offer: $189k (12.7% below list) — sets the bar for 1% rule.
- Local home prices are declining (-3.0%/yr); year-one equity from $1k of loan paydown is wiped out by about $6k of value loss. Plan a longer hold.
- Location reads 71/100 on livability (#313 in TX) — a middle-class / working-renter tenant base. Strengths: employment A+, housing A+, crime A; Watch: schools F, amenities F, commute F.
- Jarrell ISD (rural): math 19% / reading 28% proficiency, ranked #713 of 826 in TX (top 86%) — low school quality limits family demand, transient renter base, plan for 1-2y turnover.
- Market conditions: Rents soft (-1.7%/yr); 761 active listings in the ZIP; 12 comparable units currently listed for rent nearby; rentals at typical pace (median 24d on market — plan ~3-4 weeks tenant-placement turnaround); 42% of comp listings sitting > 30 days — soft ceiling on asking rent; solid renter incomes; 7,543 units permitted in Williamson County in 2024 (1,425 in 5+ unit buildings).
- Williamson County population projected at +69% by 2050 — long-run rental-demand tailwind backs the buy-and-hold thesis.
- Cap rate 6.3% vs local median 4.7% in Jarrell — top-decile yield for the area; either an underpriced asset or a hidden risk that comps aren't pricing in. Stress-test before assuming the spread holds.
Questions for listing agent
- What do current leases actually rent for vs. the listed asking? Can we see a recent rent roll and the last 12 months of T-12 income?
- Is there a deadline driving the sale (1031 exchange, divorce, estate, relocation)? That informs how much negotiation room exists.
- Schools are F-rated, which usually means shorter tenancies and higher turnover. Who's the typical renter profile here, and what's been the actual vacancy rate?
- The area grade is low — what's the realistic commute time and amenity access for the typical tenant pool here? Any planned neighborhood developments (good or bad) we should know about?
- What's the average days-on-market for RENTAL listings here right now (not sales)? A rising rental-DOM trend means longer vacancies and softer asking-rent achievability than the comps imply.
- What's the recent tenant-quality profile in this submarket — average credit score on applications, eviction rate, late-payment / NSF rate, and stable-employment percentage? A property-management company in the area should have these aggregated.
- How much new for-sale + rental construction is in the pipeline within 1–3 miles? Heavy new supply typically softens prices + rents 12–24 months out; constrained supply supports both.
CashFlowRE · CFR-BKB1ZM2WWKX9K8
· Data 1 day ago
cashflowre.app · 2026-05-29