203 Louisa Ln · Jarrell, TX
Flood risk No data
- FEMA flood zone
- —
- Chance of flooding over 30 yrs
- —
- Est. flood insurance / yr
- —
Fire risk No data
- Est. fire insurance / yr
- —
Heat risk No data
- Hot days now (above threshold)
- —
- Hot days in 30 yrs
- —
Wind risk No data
- Chance of severe wind over 30 yrs
- —
Air-quality risk No data
- Unhealthy air days now
- —
- Unhealthy air days in 30 yrs
- —
Risk factors via First Street. Map © Google.
Why this score? — see what drove the D grade
The composite is a weighted blend of 9 inputs, each scored 0–100. Each bar is that input's sub-score; the figure is the points it added to the 100-point composite (weight × sub-score).
- Cash flow +13.2/30.0
- ARV discount +12.6/15.0
- DSCR +4.0/10.0
- 1% rule +3.7/10.0
- Livability +3.6/5.0
- Condition / age +2.5/5.0
- Rent growth +2.1/5.0
- Schools +2.1/10.0
- Appreciation +0.0/10.0
$215,999
🖨 Deal sheet 📄 Offer letter ✓ Due diligence
Listing remarks
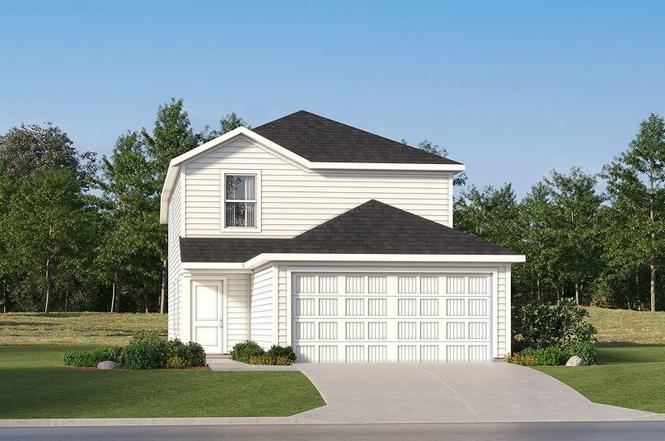
This new two-story home features a comfortable first-level owner's suite, complete with a full bathroom and walk-in closet to create a luxurious retreat. A nearby open-concept layout provides simple transitions and multitasking. Three additional bedrooms can be found on the second floor next to a versatile and inviting loft area.
Key facts
- Full bathroom
- Walk-in closet
- Versatile loft area
Tags
Property features AI
Finance
- Other: Address: 203 Louisa Ln, Jarrell, TX 76537
- Financial info: List price $215,499
Exterior
- Parking: 2-car garage (2 total parking spaces)
- Home design: Single-family property; Tilley floor plan
- Exterior features: Living area approximately 1692 (listed)
Interior
- Bedrooms: 4 bedrooms
- Bathrooms: 2 full bathrooms and 1 half bathroom
- Interior features: Spec home (Tilley plan); Active listing
Neighborhood map
What this means for you Summary
Snapshot
- This is a 4-bed/2.5-bath single-family listed at $216k.
Deal economics
- At list price, monthly cash flow is $-3 ($-37/yr) — negative.
- To cash-flow at today's rent, offer at most $216k (0.2% below list).
- To meet the 1% rule (rent ≥ 1% of price), the offer needs to be $189k (12.7% below list).
- Recommended offer: $189k (12.7% below list) — sets the bar for 1% rule.
- Cap rate 6.3% vs local median 4.7% in Jarrell — top-decile yield for the area; either an underpriced asset or a hidden risk that comps aren't pricing in. Stress-test before assuming the spread holds.
Location & tenants
- Location reads 71/100 on livability (#313 in TX) — a middle-class / working-renter tenant base. Strengths: employment A+, housing A+, crime A; Watch: schools F, amenities F, commute F.
- Jarrell ISD (rural): math 19% / reading 28% proficiency, ranked #713 of 826 in TX (top 86%) — low school quality limits family demand, transient renter base, plan for 1-2y turnover.
- Market conditions: Rents soft (-1.7%/yr); 761 active listings in the ZIP; 12 comparable units currently listed for rent nearby; rentals at typical pace (median 24d on market — plan ~3-4 weeks tenant-placement turnaround); 42% of comp listings sitting > 30 days — soft ceiling on asking rent; solid renter incomes; 7,543 units permitted in Williamson County in 2024 (1,425 in 5+ unit buildings).
Forward outlook
- Local home prices are declining (-3.0%/yr); year-one equity from $1k of loan paydown is wiped out by about $6k of value loss. Plan a longer hold.
- Williamson County population projected at +69% by 2050 — long-run rental-demand tailwind backs the buy-and-hold thesis.
Negotiation context
- Only 3 days on market — expect competitive offers; lowballing is unlikely to land.
Questions for the listing agent
- What do current leases actually rent for vs. the listed asking? Can we see a recent rent roll and the last 12 months of T-12 income?
- Is there a deadline driving the sale (1031 exchange, divorce, estate, relocation)? That informs how much negotiation room exists.
- Schools are F-rated, which usually means shorter tenancies and higher turnover. Who's the typical renter profile here, and what's been the actual vacancy rate?
- The area grade is low — what's the realistic commute time and amenity access for the typical tenant pool here? Any planned neighborhood developments (good or bad) we should know about?
- What's the average days-on-market for RENTAL listings here right now (not sales)? A rising rental-DOM trend means longer vacancies and softer asking-rent achievability than the comps imply.
- What's the recent tenant-quality profile in this submarket — average credit score on applications, eviction rate, late-payment / NSF rate, and stable-employment percentage? A property-management company in the area should have these aggregated.
- How much new for-sale + rental construction is in the pipeline within 1–3 miles? Heavy new supply typically softens prices + rents 12–24 months out; constrained supply supports both.
Investment metrics
- 1% rule
- 0.87% ✗
- Cap rate
- 6.28%
- Cash-on-cash
- -0.06%
- DSCR
- 1.00
- GRM
- 9.5
CMA / ARV
- ARV (on-the-fly)
- $243,648
- Comps found
- 12
Show comp detail 12 sales within ~0.75 mi
| Address | Dist | Beds/Ba | Sqft | Sold | Price | $/sf | Match |
|---|---|---|---|---|---|---|---|
| 436 Jones Beach Ln | 0.14mi | 4/2.0 | 1,600 (-5%) | 1mo | $236,990 | $148 | 82 |
| 409 Jones Beach Ln | 0.11mi | 4/2.5 | 1,867 (+10%) | 1mo | $236,999 | $127 | 77 |
| 506 Jones Beach Cv | 0.27mi | 4/2.0 | 1,600 (-5%) | 1mo | $236,990 | $148 | 75 |
| 527 Jones Beach Cv | 0.31mi | 4/2.0 | 1,600 (-5%) | 1mo | $230,990 | $144 | 73 |
| 245 Kings Row Ln | 0.20mi | 4/2.5 | 1,867 (+10%) | 1mo | $252,990 | $136 | 72 |
| 405 Jones Beach Ln | 0.10mi | 4/2.0 | 1,483 (-12%) | 1mo | $212,990 | $144 | 72 |
| 269 Kings Row Ln | 0.24mi | 4/2.5 | 1,867 (+10%) | 0mo | $226,999 | $122 | 71 |
| 417 Jones Beach Ln | 0.12mi | 4/2.0 | 1,483 (-12%) | 1mo | $220,990 | $149 | 71 |
| 433 Jones Beach Ln | 0.14mi | 4/2.0 | 1,483 (-12%) | 1mo | $208,999 | $141 | 70 |
| 533 Jones Beach Cv | 0.33mi | 4/2.0 | 1,575 (-7%) | 2mo | $246,990 | $157 | 70 |
| 125 Texas Angel Way | 0.32mi | 4/2.0 | 1,897 (+12%) | 2mo | $228,990 | $121 | 62 |
| 112 Texas Angel Way | 0.35mi | 4/2.0 | 1,897 (+12%) | 1mo | $229,990 | $121 | 61 |
Match score weights: distance 35% · size 25% · config 20% · recency 20%. Top-matched comps best support the ARV.
Projected returns pro-forma
-3.0% appreciation · 0.0% rent growth · sell at horizon
- IRR
- -19.8%
- Equity multiple
- 0.33×
- Total profit
- $-40,695
- Equity at exit
- $32,206
- IRR
- -20.9%
- Equity multiple
- 0.06×
- Total profit
- $-56,930
- Equity at exit
- $18,676
Cash invested: $60,480 (down + closing). Projections, not guarantees.
Landlord ↔ Tenant lean methodology
- Overall (STATE)
- 87 Strongly Landlord-Friendly
- State Texas
- 87 Strongly Landlord-Friendly · R+5
- County
- — inherits STATE
- City
- — inherits STATE
ZIP-level market 76537
- Home prices YoY
- -14.4%
- Rents YoY
- -1.7%
- Active inventory
- 761
- Price-to-rent
- 9.5×
Monthly cashflow live
- Estimated rent
- $1,886 high interval (Pro) →
- Mortgage (P&I)
- −$1,133
- Tax est. 1.5%
- −$270 /mo · $3,240/yr
- Insurance
- −$90
- HOA
- −$0
- Vacancy / Maint / Mgmt
- −$396
- Net cashflow
- $-3
Break-even live
UW: 25.0% down · 7.5% · 30yr · 1.5% tax · 5.0% vac · 8.0% maint · 8.0% mgmt
Financing live
Cash to close
- Down payment
- $54,000
- Closing costs
- $6,480
- Reserves months
- —
- Total cash needed
- —
Loan-product check · same deal, 3 products live
Conventional
25% down · 7.5% · 30yr
- Down + closing
- —
- Monthly P&I
- —
- Monthly cashflow
- —
- DSCR
- —
- Eligible?
- —
Personal DTI + credit; lowest rate.
DSCR
20% down · 8.5% · 30yr
- Down + closing
- —
- Monthly P&I
- —
- Monthly cashflow
- —
- DSCR
- —
- Eligible?
- —
No personal income docs; deal must DSCR.
Hard money
10% down · 12.0% · 12mo
- Down + closing
- —
- Monthly P&I
- —
- Monthly cashflow
- —
- DSCR
- —
- Eligible?
- —
Short-term bridge; refi at stabilization.
Rent comps 12 comps
| Address | Beds | Baths | Sqft | Rent | $/sqft | DOM | Units | Dist |
|---|---|---|---|---|---|---|---|---|
| 100 Tugboat Annie WAY Jarrell, TX | 4.0 | 2.5 | 1984 | $1,799 | $0.91 | 43d | 1 | 0.09mi |
| 136 Texas Angel Way Jarrell, TX | 3.0 | 2.0 | 1450 | $1,495 | $1.03 | 43d | 1 | 0.30mi |
| 136 Texas Angel Way Jarrell, TX | 3.0 | 2.0 | 1450 | $1,550 | $1.07 | 4d | 1 | 0.30mi |
| 133 Texas Angel Way Jarrell, TX | 3.0 | 2.0 | 1230 | $1,500 | $1.22 | 23d | 1 | 0.31mi |
| 112 Texas Angel Way Jarrell, TX | 4.0 | 2.0 | 1897 | $1,890 | $1.00 | 17d | 1 | 0.35mi |
| 128 Hasty Heart Ct Jarrell, TX | 4.0 | 2.0 | 1606 | $1,775 | $1.11 | 17d | 1 | 0.37mi |
| 337 Rancho del Cielo Loop Georgetown, TX | 3.0 | 2.0 | 1411 | $1,535 | $1.09 | 20d | 1 | 0.38mi |
| 516 Rancho del Cielo Loop Jarrell, TX | 3.0 | 2.0 | 1274 | $1,700 | $1.33 | 43d | 1 | 0.39mi |
| 544 Rancho del Cielo Loop Georgetown, TX | 4.0 | 2.0 | 1606 | $1,800 | $1.12 | 43d | 1 | 0.44mi |
| 564 Rancho del Cielo Loop Jarrell, TX | 3.0 | 2.0 | 1266 | $1,600 | $1.26 | 2d | 1 | 0.47mi |
| 856 Rancho del Cielo Loop Jarrell, TX | 3.0 | 2.0 | 1447 | $1,600 | $1.11 | 43d | 1 | 0.57mi |
| 253 Tugboat Annie Way Jarrell, TX | 3.0 | 2.0 | 1380 | $1,495 | $1.08 | 14d | 1 | 0.59mi |
Listing history 6 events
-
2026-06-18price $215,999 Active 3 DOM
-
2026-06-18days on market $215,249 Active 3 DOM
-
2026-06-18price $215,249 Active 2 DOM
-
2026-06-17pricedays on market $214,499 Active 2 DOM
-
2026-06-16remarks 331-char remark
-
2026-06-16$215,499 Active 1 DOM
ⓘ Source: listings_history table (triggers on properties + properties_extension) + one-shot
backfill from property_details.listing_events for pre-trigger history.
Nearby sold comps map
Loading sold comps map…
Walkable amenities ~0.75 mi
Loading nearby amenities…
Taxation est. · year 1
- Rental income
- $22,627
- − Mortgage interest
- −$12,099
- − Property taxes
- −$3,240
- − Insurance
- −$1,080
- − Repairs & maintenance
- −$1,810
- − Management
- −$1,810
- − Depreciation
- −$6,284
- Taxable loss
- −$3,696
- Est. tax savings @ 24.0%
- +$887
- After-tax cash flow
- $850/yr
For passive investors: Depreciation is non-cash, so a rental often shows a tax loss while cash-flowing — sheltering income. Rental losses are passive: they offset passive income freely, and up to $25,000/yr can offset ordinary (W-2) income if you actively participate and your MAGI is under $100k (phasing out to $0 by $150k); unused losses carry forward. On sale, claimed depreciation is recaptured at up to 25%, and gains may owe capital-gains tax (a 1031 exchange can defer both). Figures are a year-1 estimate at your 24.0% rate — not tax advice; consult a CPA.
Schools (NCES district)
- District
- Jarrell ISD
- NCES district ID
- 4824600
- Math proficiency
- 19% ▼ -18.00%
- Reading proficiency
- 28% ▼ -5.00%
- Median HH income
- $57,132
- Composite
- 21.47/100
- National rank
- #8335
- State rank
- #713 of 826 in TX
Livability — Jarrell
- Score
- 71/100
- State rank
- #313
- US rank
- #7020
Category grades
Schools grade is shown separately in the Schools card above.
Census & demographics
- County
- Williamson County · 680,029 people
- City population
- 16,272
- Metro
- Austin-Round Rock-Georgetown, TX
- Population (ZIP)
- 16,272
- Household income
- $98,199
- Rent vs Own
- Severe rent burden
- 225.0
Population outlook (Williamson County) Hauer SSP2
- Today (2025)
- 699,027 people
- By 2030
- 795,537 · +13.8%
- By 2040
- 990,683 · +41.7%
- By 2050
- 1,184,292 · +69.4%
- By 2075
- 1,623,825 · +132.3%
- By 2100
- 1,924,153 · +175.3%
Race, ethnicity, and origin ACS 2023
- Neighborhood character
- Diverse neighborhood (Simpson 0.63)
- Race & ethnicity
- White 48% Hispanic / Latino 36% Two or more races 14% Black 7% Asian 4%
- Hispanic origin (detail)
- Mexican 30% Puerto Rican 5%
- Common ancestry
- Romanian 3% Italian 2% Slovak 1%
- Foreign-born
- 13% · Canada, Vietnam
- Languages at home
- 69% English-only · Spanish 26% Chinese 2% French/Haitian/Cajun 1%
Political lean MEDSL · Williamson
- 2024 margin
- Toss-up / Even · D 48.0% · R 50.4% · Other 1.6%
- 2008→2024 swing
- +10.6pp toward D · 2008: -13.0pp · 2024: -2.5pp
- All cycles
- 2024: R+2.5 2020: D+1.4 2016: R+9.9 2012: R+21.5 2008: R+13.0
Not yet ingested
- Civics
- —
Market trends
- HPI YoY
- ▼ -31.03%
- Current HPI
- 184.8935
- Rent YoY
- ▼ -1.73%
- Metro
- Austin-Round Rock-Georgetown, TX
- State GDP YoY
- ▲ 3.95%
- F500 in state
- 110
Industry mix (Fortune 500 HQ in TX)
| Industry | F500 HQs | Revenue |
|---|---|---|
| Energy | 16 | $1,198B |
|
||
| Technology | 5 | $198B |
|
||
| Engineering / Construction | 4 | $72B |
|
||
| Energy Services | 3 | $60B |
|
||
| Utilities | 3 | $41B |
|
||
| Healthcare | 2 | $330B |
|
||
Cash-flow waterfall
monthlySold comps — $/sqft
last 12 mo · ≤1 miLoading sold comps…