1-1 1 Victory Ave, Lot 26, Pennsville, Nj 08070 Lot 26
Pennsville, NJ 08070
$89,900D+
2 bd · 1.0 ba ·
832 sqft ·
Built 2026
· SingleFamily
· Active
· 37 DOM
Cashflow @ list (25.0% down · 7.5%)
Estimated rent
$1,661/mo
Mortgage (P&I)
−$471
Tax + insurance
−$150
HOA
−$780
Vac / Maint / Mgmt
−$349
Net cashflow
$-89/mo
Annual
$-1,071/yr
Cap rate
5.10%
Cash-on-cash
-4.25%
DSCR
0.81
1% rule
1.85%
Cash to close
$25,172
Investor read
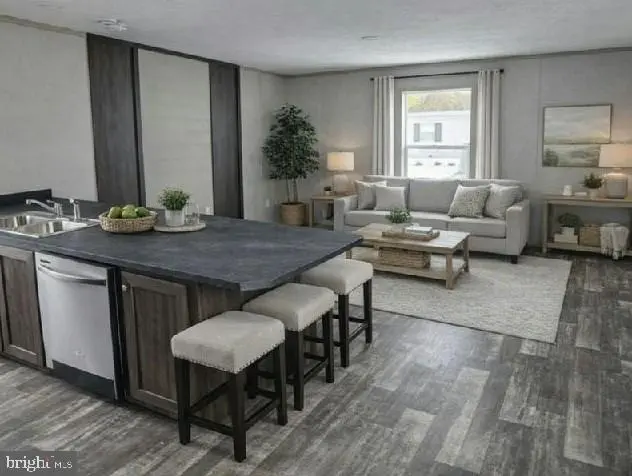
- This is a 2-bed/1.0-bath single-family listed at $90k. Condition is rated good.
- At list price, monthly cash flow is $-89 ($-1k/yr) — negative.
- To cash-flow at today's rent, offer at most $77k (14.4% below list).
- Meets the 1% rule at list price ($2k rent vs $90k).
- It's been on market 37 days — a 3% lower offer ($87k) is reasonable based on typical stale-listing flexibility.
- Recommended offer: $77k (14.4% below list) — sets the bar for cash-flow.
- Local home prices are declining (-3.0%/yr); year-one equity from $622 of loan paydown is wiped out by about $3k of value loss. Plan a longer hold.
- Location reads 72/100 on livability (#225 in NJ) — a middle-class / working-renter tenant base. Strengths: housing A+, health & safety A+, cost of living A-; Watch: schools C-, amenities F, commute F.
- Pennsville Public School District (suburban): math 12% / reading 45% proficiency, ranked #356 of 472 in NJ (top 75%) — low school quality limits family demand, transient renter base, plan for 1-2y turnover.
- Watch-outs: HOA is 47% of rent.
- Market conditions: 84 active listings in the ZIP; 95 units permitted in Salem County in 2024 (0 in 5+ unit buildings).
- Salem County population projected at -23% by 2050 — secular population decline; favor cash flow + early exit over multi-decade hold.
- Climate carrying-cost: moderate flood risk; major wind risk, 27% chance of damaging wind over 30y; extreme-heat days projected 7→15/yr by 2055 (HVAC capex compounding) — expect insurance premiums to compound above CPI over the hold.
- Cap rate 5.1% vs local median 3.6% in Pennsville — top-decile yield for the area; either an underpriced asset or a hidden risk that comps aren't pricing in. Stress-test before assuming the spread holds.
Questions for listing agent
- What do current leases actually rent for vs. the listed asking? Can we see a recent rent roll and the last 12 months of T-12 income?
- It's been on market 37 days. Have you received any prior offers? Is the seller open to a 14% concession, seller financing, or rate buy-down credit?
- What does the HOA fee cover, when was the last increase, and are there any pending special assessments or reserve-fund shortfalls?
- Is there a deadline driving the sale (1031 exchange, divorce, estate, relocation)? That informs how much negotiation room exists.
- The area grade is low — what's the realistic commute time and amenity access for the typical tenant pool here? Any planned neighborhood developments (good or bad) we should know about?
- What's the average days-on-market for RENTAL listings here right now (not sales)? A rising rental-DOM trend means longer vacancies and softer asking-rent achievability than the comps imply.
- What's the recent tenant-quality profile in this submarket — average credit score on applications, eviction rate, late-payment / NSF rate, and stable-employment percentage? A property-management company in the area should have these aggregated.
- How much new for-sale + rental construction is in the pipeline within 1–3 miles? Heavy new supply typically softens prices + rents 12–24 months out; constrained supply supports both.
CashFlowRE · CFR-BKT7DR2YY7PGPD
· Data 2 days ago
cashflowre.app · 2026-05-29