1-1 1 Victory Ave, Lot 26, Pennsville, Nj 08070 Lot 26 · Pennsville, NJ
Flood risk 5/10 · Moderate
- FEMA flood zone
- B
- Chance of flooding over 30 yrs
- 0.26%
- Est. flood insurance / yr
- $723 – $2,747
Fire risk 1/10 · Minimal
- Est. fire insurance / yr
- $526 – $976
Heat risk 7/10 · Major
- Hot days now (above 104°F)
- 7 days/yr
- Hot days in 30 yrs
- 15 days/yr
Wind risk 6/10 · Moderate
- Chance of severe wind over 30 yrs
- 27.0%
Air-quality risk 3/10 · Minor
- Unhealthy air days now
- 3 days/yr
- Unhealthy air days in 30 yrs
- 5 days/yr
Risk factors via First Street. Map © Google.
Why this score? — see what drove the D+ grade
The composite is a weighted blend of 9 inputs, each scored 0–100. Each bar is that input's sub-score; the figure is the points it added to the 100-point composite (weight × sub-score).
- ARV discount +15.0/15.0
- 1% rule +10.0/10.0
- Cash flow +8.1/30.0
- Condition / age +3.8/5.0
- Livability +3.6/5.0
- Schools +2.6/10.0
- Rent growth +2.5/5.0
- DSCR +2.1/10.0
- Appreciation +0.0/10.0
$89,900
🖨 Deal sheet 📄 Offer letter ✓ Due diligence
Listing remarks
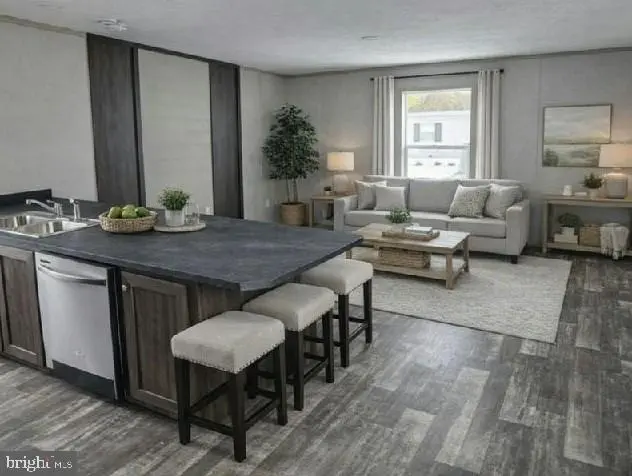
Don’t miss the opportunity to own this charming 2-bedroom, 1-bath home located in a quiet, professionally managed community. This home offers a comfortable layout, cozy living space, and the perfect setting for peaceful everyday living. Ideal for small families, couples, or anyone looking to downsize while still enjoying comfort and convenience. Home staged via AI * * * This home is perfect for a small family or couple seeking an affordable, low-maintenance living option in a quiet, well-managed community. It’s especially well-suited for first-time buyers, downsizers, or someone looking for a simple, comfortable space with manageable upkeep and long-term value.
Key facts
- Built 2026
- Listed 37 days
Property features AI
Finance
- Other: Located in Pennsville Township; Tidal water: no
- HOA & community: HOA fee of $780 per month; Property manager present
Exterior
- Parking: Other parking
- Utilities: Public water; Public sewer
- Home design: Manufactured home (single wide); Model: The Gem; Make: Clayton; Dimensions approximately 16 ft. by 52 ft.; Estimated year built
- Construction: Above-grade construction
- Exterior features: Not in a federal flood zone; Other above-grade structures; Pets allowed with breed restrictions
Interior
- Bedrooms: 2 bedrooms on the main level
- Bathrooms: 1 full bathroom on the main level
- Heating & cooling: Central heating (natural gas); Central air conditioning (natural gas)
- Interior features: Estimated living area
- Laundry & utility: Washer/dryer hookup
Neighborhood map
What this means for you Summary
Snapshot
- This is a 2-bed/1.0-bath single-family listed at $90k. Condition is rated good.
Deal economics
- At list price, monthly cash flow is $-89 ($-1k/yr) — negative.
- To cash-flow at today's rent, offer at most $77k (14.4% below list).
- Meets the 1% rule at list price ($2k rent vs $90k).
- Recommended offer: $77k (14.4% below list) — sets the bar for cash-flow.
- Cap rate 5.1% vs local median 3.6% in Pennsville — top-decile yield for the area; either an underpriced asset or a hidden risk that comps aren't pricing in. Stress-test before assuming the spread holds.
Location & tenants
- Location reads 72/100 on livability (#225 in NJ) — a middle-class / working-renter tenant base. Strengths: housing A+, health & safety A+, cost of living A-; Watch: schools C-, amenities F, commute F.
- Pennsville Public School District (suburban): math 12% / reading 45% proficiency, ranked #356 of 472 in NJ (top 75%) — low school quality limits family demand, transient renter base, plan for 1-2y turnover.
- Market conditions: 84 active listings in the ZIP; 95 units permitted in Salem County in 2024 (0 in 5+ unit buildings).
Forward outlook
- Local home prices are declining (-3.0%/yr); year-one equity from $622 of loan paydown is wiped out by about $3k of value loss. Plan a longer hold.
- Salem County population projected at -23% by 2050 — secular population decline; favor cash flow + early exit over multi-decade hold.
Negotiation context
- It's been on market 37 days — a 3% lower offer ($87k) is reasonable based on typical stale-listing flexibility.
Risks & watch-outs
- Watch-outs: HOA is 47% of rent.
- Climate carrying-cost: moderate flood risk; major wind risk, 27% chance of damaging wind over 30y; extreme-heat days projected 7→15/yr by 2055 (HVAC capex compounding) — expect insurance premiums to compound above CPI over the hold.
Questions for the listing agent
- What do current leases actually rent for vs. the listed asking? Can we see a recent rent roll and the last 12 months of T-12 income?
- It's been on market 37 days. Have you received any prior offers? Is the seller open to a 14% concession, seller financing, or rate buy-down credit?
- What does the HOA fee cover, when was the last increase, and are there any pending special assessments or reserve-fund shortfalls?
- Is there a deadline driving the sale (1031 exchange, divorce, estate, relocation)? That informs how much negotiation room exists.
- The area grade is low — what's the realistic commute time and amenity access for the typical tenant pool here? Any planned neighborhood developments (good or bad) we should know about?
- What's the average days-on-market for RENTAL listings here right now (not sales)? A rising rental-DOM trend means longer vacancies and softer asking-rent achievability than the comps imply.
- What's the recent tenant-quality profile in this submarket — average credit score on applications, eviction rate, late-payment / NSF rate, and stable-employment percentage? A property-management company in the area should have these aggregated.
- How much new for-sale + rental construction is in the pipeline within 1–3 miles? Heavy new supply typically softens prices + rents 12–24 months out; constrained supply supports both.
Investment metrics
- 1% rule
- 1.85% ✓
- Cap rate
- 5.10%
- Cash-on-cash
- -4.25%
- DSCR
- 0.81
- GRM
- 4.5
CMA / ARV
- ARV (on-the-fly)
- $124,800
- Comps found
- 10
Show comp detail 10 sales within ~0.75 mi
| Address | Dist | Beds/Ba | Sqft | Sold | Price | $/sf | Match |
|---|---|---|---|---|---|---|---|
| 239 Pin Oak | 0.45mi | 2/1.0 | 800 (-4%) | 1mo | $45,000 | $56 | 72 |
| 59 Forest Dr | 0.45mi | 2/2.0 | 800 (-4%) | 0mo | $105,000 | $131 | 68 |
| 226 Pin Oak Dr | 0.38mi | 2/1.0 | 800 (-4%) | 11mo | $49,000 | $61 | 66 |
| 1 Victory Ave Unit 36A | 0.05mi | 2/1.0 | 720 (-14%) | 24mo | $42,000 | $58 | 56 |
| 12 Dennis Dr | 0.51mi | 2/1.0 | 800 (-4%) | 20mo | $85,000 | $106 | 53 |
| 94 White Oaks Dr | 0.36mi | 2/2.0 | 720 (-14%) | 5mo | $135,000 | $188 | 52 |
| 86 Mobile Dr | 0.42mi | 2/2.0 | 900 (+8%) | 15mo | $135,000 | $150 | 50 |
| 50 Pennington Dr | 0.51mi | 2/2.0 | 900 (+8%) | 11mo | $135,500 | $151 | 50 |
| 35 Pennington Dr | 0.53mi | 2/2.0 | 800 (-4%) | 19mo | $120,000 | $150 | 49 |
| 4 Dunlap Ave | 0.30mi | 3/2.0 (+1) | 952 (+14%) | 8mo | $215,509 | $226 | 46 |
Match score weights: distance 35% · size 25% · config 20% · recency 20%. Top-matched comps best support the ARV.
Projected returns pro-forma
-3.0% appreciation · 3.0% rent growth · sell at horizon
- IRR
- -22.7%
- Equity multiple
- 0.22×
- Total profit
- $-19,747
- Equity at exit
- $13,404
- IRR
- -15.3%
- Equity multiple
- 0.11×
- Total profit
- $-22,465
- Equity at exit
- $7,773
Cash invested: $25,172 (down + closing). Projections, not guarantees.
Landlord ↔ Tenant lean methodology
- Overall (STATE)
- 21 Tenant-Leaning
- State New Jersey
- 21 Tenant-Leaning · D+6
- County
- — inherits STATE
- City
- — inherits STATE
ZIP-level market 08070
- Home prices YoY
- -23.7%
- Active inventory
- 84
- Price-to-rent
- 4.5×
Monthly cashflow live
- Estimated rent
- $1,661 medium interval (Pro) →
- Mortgage (P&I)
- −$471
- Tax est. 1.5%
- −$112 /mo · $1,348/yr
- Insurance
- −$37
- HOA
- −$780
- Vacancy / Maint / Mgmt
- −$349
- Net cashflow
- $-89
Break-even live
UW: 25.0% down · 7.5% · 30yr · 1.5% tax · 5.0% vac · 8.0% maint · 8.0% mgmt
Financing live
Cash to close
- Down payment
- $22,475
- Closing costs
- $2,697
- Reserves months
- —
- Total cash needed
- —
Loan-product check · same deal, 3 products live
Conventional
25% down · 7.5% · 30yr
- Down + closing
- —
- Monthly P&I
- —
- Monthly cashflow
- —
- DSCR
- —
- Eligible?
- —
Personal DTI + credit; lowest rate.
DSCR
20% down · 8.5% · 30yr
- Down + closing
- —
- Monthly P&I
- —
- Monthly cashflow
- —
- DSCR
- —
- Eligible?
- —
No personal income docs; deal must DSCR.
Hard money
10% down · 12.0% · 12mo
- Down + closing
- —
- Monthly P&I
- —
- Monthly cashflow
- —
- DSCR
- —
- Eligible?
- —
Short-term bridge; refi at stabilization.
HOA detail
- Monthly dues
- $780 · $9,360/yr
Listing history 15 events
-
2026-06-18days on market $89,900 Active 37 DOM
-
2026-06-17days on market $89,900 Active 36 DOM
-
2026-06-16days on market $89,900 Active 35 DOM
-
2026-06-15days on market $89,900 Active 34 DOM
-
2026-06-13days on market $89,900 Active 32 DOM
-
2026-06-13days on market $89,900 Active 31 DOM
-
2026-06-09days on market $89,900 Active 28 DOM
-
2026-06-08days on market $89,900 Active 27 DOM
-
2026-06-07days on market $89,900 Active 26 DOM
-
2026-06-04days on market $89,900 Active 23 DOM
-
2026-06-03days on market $89,900 Active 22 DOM
-
2026-06-02days on market $89,900 Active 21 DOM
-
2026-06-01days on market $89,900 Active 20 DOM
-
2026-05-31days on market $89,900 Active 19 DOM
-
2026-05-12$89,900 Active
ⓘ Source: listings_history table (triggers on properties + properties_extension) + one-shot
backfill from property_details.listing_events for pre-trigger history.
Climate risk First Street
- Flood 5/10 Major FEMA zone B · 26% chance over 30 yrs
- Wildfire 1/10 Low
- Heat 7/10 Severe 7 d/yr ≥104°F today · 15 d/yr by 30 yrs out
- Wind 6/10 Major 27% chance of damaging wind over 30 yrs
- Air quality 3/10 Moderate 3 unhealthy d/yr today · 5 by 30 yrs out
Nearby sold comps map
Loading sold comps map…
Walkable amenities ~0.75 mi
Loading nearby amenities…
Taxation est. · year 1
- Rental income
- $19,930
- − Mortgage interest
- −$5,036
- − Property taxes
- −$1,348
- − Insurance
- −$450
- − Repairs & maintenance
- −$1,594
- − Management
- −$1,594
- − HOA
- −$9,360
- − Depreciation
- −$2,615
- Taxable loss
- −$2,068
- Est. tax savings @ 24.0%
- +$496
- After-tax cash flow
- $-575/yr
For passive investors: Depreciation is non-cash, so a rental often shows a tax loss while cash-flowing — sheltering income. Rental losses are passive: they offset passive income freely, and up to $25,000/yr can offset ordinary (W-2) income if you actively participate and your MAGI is under $100k (phasing out to $0 by $150k); unused losses carry forward. On sale, claimed depreciation is recaptured at up to 25%, and gains may owe capital-gains tax (a 1031 exchange can defer both). Figures are a year-1 estimate at your 24.0% rate — not tax advice; consult a CPA.
Condition & rehab AI · 6 photos
This charming 2-bedroom, 1-bath home in a quiet, professionally managed community is in good condition with minimal repairs needed. It offers a comfortable layout and is perfect for small families or couples seeking an affordable, low-maintenance living option.
Value-add opportunities
- Both Painting exterior and interior walls — Fresh paint can enhance curb appeal and interior aesthetics.
- Both Landscaping improvements — Enhanced landscaping can improve curb appeal and add value.
- Both New flooring in bathrooms — Modern flooring can improve the look and feel of the bathrooms.
- Both New kitchen appliances — Upgraded appliances can enhance the kitchen's functionality and appeal.
- Both New bathroom fixtures — Modern fixtures can improve the bathroom's functionality and aesthetics.
Renovation cost estimate screening
Value-add ROI direction
- Both Painting exterior and interior walls — Fresh paint can enhance curb appeal and interior aesthetics. ↑
- Both Landscaping improvements — Enhanced landscaping can improve curb appeal and add value. ↑
- Both New flooring in bathrooms — Modern flooring can improve the look and feel of the bathrooms. ↑
- Both New kitchen appliances — Upgraded appliances can enhance the kitchen's functionality and appeal. ↑
- Both New bathroom fixtures — Modern fixtures can improve the bathroom's functionality and aesthetics. ↑
ⓘ Cost ranges are severity-bucket heuristics (US national rule-of-thumb). Get contractor quotes + a written scope before underwriting a rehab budget.
Schools (NCES district)
- District
- Pennsville Public School District
- NCES district ID
- 3409120
- Math proficiency
- 12% ▼ -26.00%
- Reading proficiency
- 45% ▬ 0.00%
- Median HH income
- $58,237
- Composite
- 25.61/100
- National rank
- #7411
- State rank
- #356 of 472 in NJ
Livability — Pennsville
- Score
- 72/100
- State rank
- #225
- US rank
- #6134
Category grades
Schools grade is shown separately in the Schools card above.
Census & demographics
- Census place
- Pennsville, NJ
- City population
- 12,766
- Population (ZIP)
- 12,477
Population outlook (Salem County) Hauer SSP2
- Today (2025)
- 59,905 people
- By 2030
- 57,351 · -4.3%
- By 2040
- 51,837 · -13.5%
- By 2050
- 46,356 · -22.6%
- By 2075
- 36,452 · -39.2%
- By 2100
- 28,907 · -51.7%
Race, ethnicity, and origin ACS 2023
- Neighborhood character
- Predominantly White (84%)
- Race & ethnicity
- White 84% Hispanic / Latino 7% Two or more races 5% Black 4%
- Hispanic origin (detail)
- Mexican 1% Puerto Rican 4%
- Common ancestry
- Romanian 6% Slovak 2% Lithuanian 1%
- Foreign-born
- 3% · Canada
- Languages at home
- 93% English-only · Other Indo-European 4% Spanish 2%
Political lean MEDSL · Salem
- 2024 margin
- R (+19.2) · D 39.6% · R 58.8% · Other 1.6%
- 2008→2024 swing
- -23.1pp toward R · 2008: 3.9pp · 2024: -19.2pp
- All cycles
- 2024: R+19.2 2020: R+12.8 2016: R+15.4 2012: D+0.8 2008: D+3.9
Not yet ingested
- Civics
- —
Market trends
- HPI YoY
- ▼ -85.34%
- Current HPI
- 275.2185
- Rent YoY
- —
- Metro
- —
- State GDP YoY
- ▲ 2.05%
- F500 in state
- 34
Industry mix (Fortune 500 HQ in NJ)
| Industry | F500 HQs | Revenue |
|---|---|---|
| Consumer Goods | 3 | $31B |
|
||
| Pharmaceuticals | 2 | $153B |
|
||
| Technology | 2 | $21B |
|
||
| Insurance | 2 | $20B |
|
||
| Healthcare | 2 | $19B |
|
||
| Financial Services | 1 | $70B |
|
||
Price history
1 event — show timeline
- 2026-05-12 Listed $89,900 BRIGHT MLS
Cash-flow waterfall
monthlySold comps — $/sqft
last 12 mo · ≤1 miLoading sold comps…