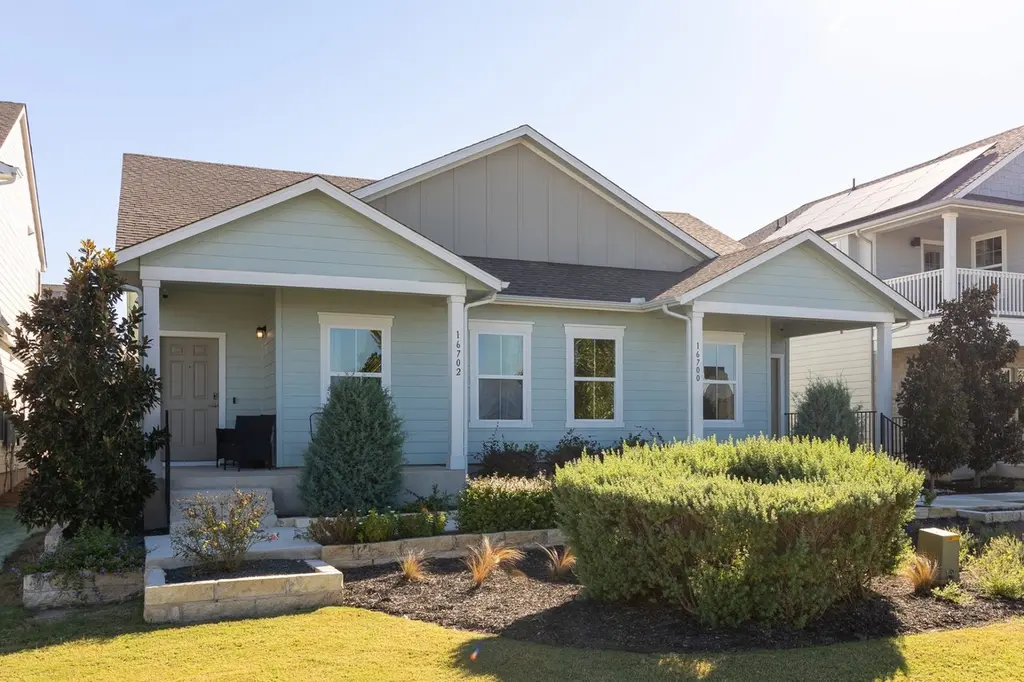
16702 Sonoma Breeze Dr
Austin, TX 78653
$247,900D
2 bd · 2.0 ba ·
1,348 sqft ·
Built 2023
· Townhouse
· Active
· 93 DOM
Cashflow @ list (25.0% down · 7.5%)
Estimated rent
$2,112/mo
Mortgage (P&I)
−$1,300
Tax + insurance
−$504
HOA
−$17
Vac / Maint / Mgmt
−$444
Net cashflow
$-152/mo
Annual
$-1,828/yr
Cap rate
5.56%
Cash-on-cash
-2.63%
DSCR
0.88
1% rule
0.85%
Cash to close
$69,412
Investor read
- This is a 2-bed/2.0-bath townhouse listed at $248k. Condition is rated good.
- At list price, monthly cash flow is $-152 ($-2k/yr) — negative.
- To cash-flow at today's rent, offer at most $221k (10.9% below list).
- To meet the 1% rule (rent ≥ 1% of price), the offer needs to be $211k (14.8% below list).
- It's been on market 93 days — a 9% lower offer ($226k) is reasonable based on typical stale-listing flexibility.
- Recommended offer: $211k (14.8% below list) — sets the bar for 1% rule.
- Local home prices are declining (-3.0%/yr); year-one equity from $2k of loan paydown is wiped out by about $7k of value loss. Plan a longer hold.
- Location reads 82/100 on livability (#16 in TX, #1,208 nationally) — a professional / high-income tenant draw. Strengths: amenities A+, commute A+, employment A+; Watch: cost of living D, crime F.
- Del Valle ISD (rural): math 19% / reading 26% proficiency, ranked #749 of 826 in TX (top 91%) — low school quality limits family demand, transient renter base, plan for 1-2y turnover; 77% free/reduced lunch — lower-income household profile, screen leases tightly.
- Market conditions: Rents flat; 664 active listings in the ZIP; 14 comparable units currently listed for rent nearby; rentals at typical pace (median 24d on market — plan ~3-4 weeks tenant-placement turnaround); solid renter incomes; 17,121 units permitted in Travis County in 2024 (11,963 in 5+ unit buildings).
- Travis County population projected at +60% by 2050 — long-run rental-demand tailwind backs the buy-and-hold thesis.
- 4 sale attempts; this cycle's ask has dropped $42k (14%) from the opening price — seller is motivated, your offer sets the floor, not the list.
- Climate carrying-cost: severe wind risk, 80% chance of damaging wind over 30y; extreme-heat days projected 7→20/yr by 2055 (HVAC capex compounding) — expect insurance premiums to compound above CPI over the hold.
- Cap rate 5.6% vs local median 1.8% in Austin — top-decile yield for the area; either an underpriced asset or a hidden risk that comps aren't pricing in. Stress-test before assuming the spread holds.
Questions for listing agent
- What do current leases actually rent for vs. the listed asking? Can we see a recent rent roll and the last 12 months of T-12 income?
- It's been on market 93 days. Have you received any prior offers? Is the seller open to a 15% concession, seller financing, or rate buy-down credit?
- What does the HOA fee cover, when was the last increase, and are there any pending special assessments or reserve-fund shortfalls?
- Why hasn't it sold? Are there any deal-killer items the seller is aware of (foundation, flood, title, zoning, code violations)?
- Is there a deadline driving the sale (1031 exchange, divorce, estate, relocation)? That informs how much negotiation room exists.
- Crime grade is F in this area — have there been break-ins, vandalism, or insurance claims at this property in the last 3 years? What carrier currently insures it and at what premium?
- The area grade is low — what's the realistic commute time and amenity access for the typical tenant pool here? Any planned neighborhood developments (good or bad) we should know about?
- What's the average days-on-market for RENTAL listings here right now (not sales)? A rising rental-DOM trend means longer vacancies and softer asking-rent achievability than the comps imply.
CashFlowRE · CFR-BMATN46KRTK09C
· Data 2 days ago
cashflowre.app · 2026-05-29