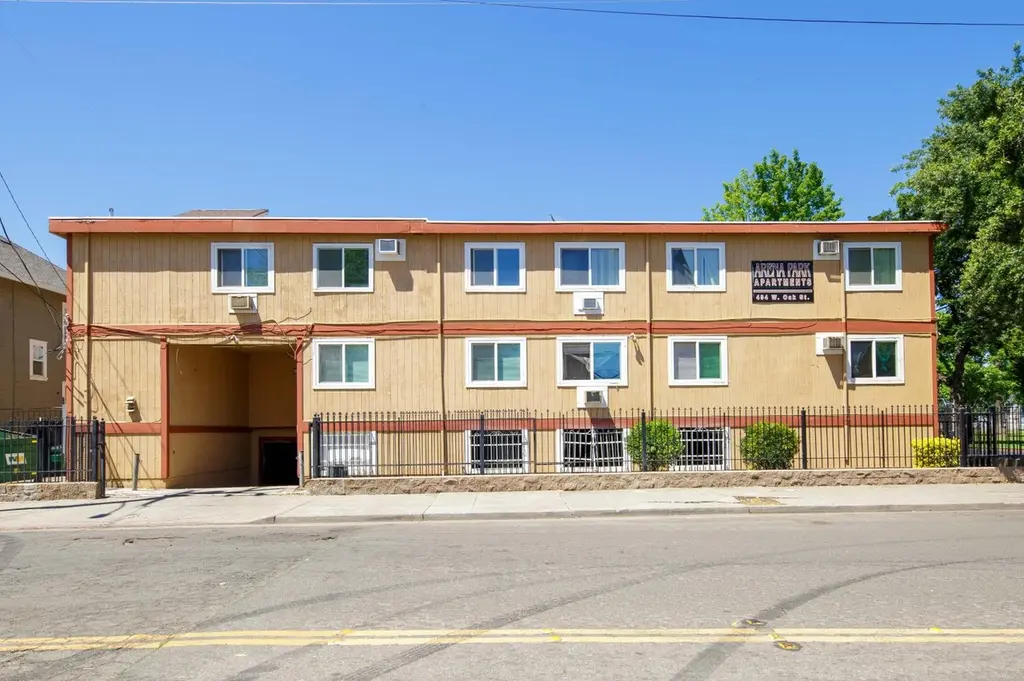
404 W Oak St
Stockton, CA 95203
$1,080,000B-
240 bd · 225.0 ba ·
9,868 sqft ·
Built 1976
· MultiFamily
· Pending
· 11 DOM
Cashflow @ list (25.0% down · 7.5%)
Estimated rent
$27,725/mo
Mortgage (P&I)
−$5,664
Tax + insurance
−$1,103
HOA
−$0
Vac / Maint / Mgmt
−$5,822
Net cashflow
$15,136/mo
Annual
$181,628/yr
Cap rate
23.11%
Cash-on-cash
60.06%
DSCR
3.67
1% rule
2.57%
Cash to close
$302,400
Investor read
- This is a 15 × 16-bed/?-bath units multifamily listed at $1.08M.
- At list price, monthly cash flow is $15k ($182k/yr) — positive. Per door: $1k/mo.
- The deal already cash-flows at list — no discount required.
- Meets the 1% rule at list price ($28k rent vs $1.08M).
- Only 11 days on market — expect competitive offers; lowballing is unlikely to land.
- Local home prices are declining (-3.0%/yr); year-one equity from $7k of loan paydown is wiped out by about $32k of value loss. Plan a longer hold.
- Location reads 57/100 on livability (#734 in CA) — a working-class tenant base; expect higher turnover. Strengths: housing A+, health & safety A, amenities A-; Watch: employment C-, schools D-, crime F.
- Stockton Unified (urban): math 23% / reading 46% proficiency, ranked #295 of 517 in CA (top 57%) — families likely to look elsewhere, expect single-tenant / working-renter base with shorter leases; 78% free/reduced lunch — lower-income household profile, screen leases tightly.
- Market conditions: 64 active listings in the ZIP; 3,779 units permitted in San Joaquin County in 2024 (0 in 5+ unit buildings).
- San Joaquin County population projected at +17% by 2050 — long-run rental-demand tailwind backs the buy-and-hold thesis.
- 8 sale attempts since 3y ago; this cycle's ask is 108443% above the opening price — seller raised mid-cycle; expect resistance to lowballs.
- Current owner paid $515k; list at $1.08M implies a 110% gain — meaningful room to come down on a strong offer.
- At projected returns (-3.0% appreciation + 3.0% rent growth), your $302k cash investment doubles in ~2 years — after that, you're playing with house money.
- Climate carrying-cost: moderate flood risk; extreme-heat days projected 7→15/yr by 2055 (HVAC capex compounding) — expect insurance premiums to compound above CPI over the hold.
- Cap rate 23.1% vs local median 3.6% in Stockton — top-decile yield for the area; either an underpriced asset or a hidden risk that comps aren't pricing in. Stress-test before assuming the spread holds.
- At $27,725/mo this rent would consume 525% of the median local household income ($63k/yr) (locally 1034% of renters already pay >50% of income on rent) — very limited rent-growth headroom before tenants either downsize or default.
Questions for listing agent
- Can we see the unit-by-unit rent roll, current vacancy, and any below-market leases? What's the average tenancy length?
- What capital expenditures (roof, boiler, parking lot, exteriors) have been made in the last 5 years, and what's planned in the next 2?
- Built in 1976 — when were the roof, HVAC, electrical panel, plumbing, and water heater last replaced?
- Is there a deadline driving the sale (1031 exchange, divorce, estate, relocation)? That informs how much negotiation room exists.
- Schools are D-rated, which usually means shorter tenancies and higher turnover. Who's the typical renter profile here, and what's been the actual vacancy rate?
- Crime grade is F in this area — have there been break-ins, vandalism, or insurance claims at this property in the last 3 years? What carrier currently insures it and at what premium?
- What's the average days-on-market for RENTAL listings here right now (not sales)? A rising rental-DOM trend means longer vacancies and softer asking-rent achievability than the comps imply.
- What's the recent tenant-quality profile in this submarket — average credit score on applications, eviction rate, late-payment / NSF rate, and stable-employment percentage? A property-management company in the area should have these aggregated.
CashFlowRE · CFR-BMP6VAA86N454J
· Data 6 days ago
cashflowre.app · 2026-05-29