 15-Plex
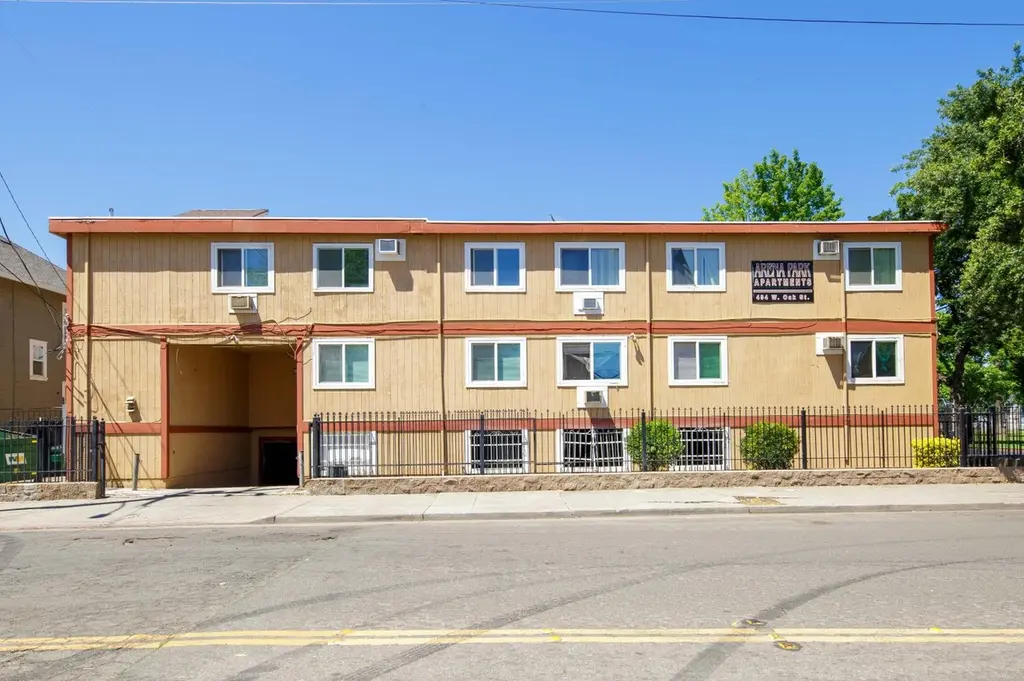
404 W Oak St · Stockton, CA
Flood risk 5/10 · Moderate
- FEMA flood zone
- X
- Chance of flooding over 30 yrs
- 0.24%
- Est. flood insurance / yr
- $507 – $1,088
Fire risk 1/10 · Minimal
- Est. fire insurance / yr
- $659 – $1,223
Heat risk 7/10 · Major
- Hot days now (above 103°F)
- 7 days/yr
- Hot days in 30 yrs
- 15 days/yr
Wind risk 1/10 · Minimal
- Chance of severe wind over 30 yrs
- —
Air-quality risk 10/10 · Severe
- Unhealthy air days now
- 30 days/yr
- Unhealthy air days in 30 yrs
- 30 days/yr
Risk factors via First Street. Map © Google.
Why this score? — see what drove the B- grade
The composite is a weighted blend of 9 inputs, each scored 0–100. Each bar is that input's sub-score; the figure is the points it added to the 100-point composite (weight × sub-score).
- Cash flow +30.0/30.0
- 1% rule +10.0/10.0
- DSCR +10.0/10.0
- ARV discount +7.5/15.0
- Schools +2.9/10.0
- Livability +2.9/5.0
- Rent growth +2.5/5.0
- Condition / age +2.5/5.0
- Appreciation +0.0/10.0
$1,080,000
🖨 Deal sheet 📄 Offer letter ✓ Due diligence
Multi-family units
County records classify this as Multi-Family (5+ Unit). Listing-text estimate: 15 units. confirmed
5+ unit building — per-unit beds/baths from public records are typically unavailable; the breakdown below (if shown) is an estimate from the listing text.
Listing remarks
Welcome to Arena Park Apartments, a well-maintained 15-unit apartment community situated on a desirable corner lot in the heart of Downtown Stockton. The property features a private, gated, refreshed, parking garage with 11 covered parking spaces and ample street parking, providing a valuable amenity for residents. Recent capital improvements include an updated electrical panel box and upgraded electrical meter system, enhancing the property's infrastructure and long-term reliability. Additional income is generated through the onsite, owner-operated coin laundry facility, creating an attractive supplemental revenue stream. Ideally located just down the street from Banner Island Ballpark and
Key facts
- 7,501 sq ft lot
- Garage
- Built 1976
Tags
Property features AI
Finance
- Financial info: Multifamily income property with a total of 15 units
- HOA & community: No homeowners association
Exterior
- Parking: Covered parking; Garage parking with interior access; Total of approximately 20 parking spaces
- Utilities: Cable available; Internet available; Natural gas connected; Public sewer; Public water with meter on site; Water served by a water/irrigation district; Separate electric meters for units
- Home design: Residential income property (apartments); Five-or-more-unit apartment building; Two-story building; Built in 1976; Known as Arena Park Apartments
- Construction: Shingle and flat roof (see remarks); Year built 1976
- Exterior features: Shingle and flat roofs (varies; see remarks); Corner lot with curbs and sidewalks; Enclosed patios (varies by unit)
Interior
- Kitchen: Free-standing gas oven; Free-standing gas range; Free-standing refrigerator
- Bedrooms: One-bedroom units (at least some units are 1-bedroom)
- Flooring: Carpet; Tile; Laminate; Linoleum; Flooring varies by unit
- Bathrooms: One full bathroom in at least some units
- Heating & cooling: Wall furnace heating; Ceiling fans; Wall-mounted cooling units; Cooling varies by unit
- Interior features: Updated/remodeled units with variations by unit; Finished basement with storage areas; Enclosed patios in some units; Dual-pane partial windows
- Laundry & utility: Coin-operated laundry in a common area; Washer/dryer owned (on-site)
Neighborhood map
What this means for you Summary
Snapshot
- This is a 15 × 16-bed/?-bath units multifamily listed at $1.08M.
Deal economics
- At list price, monthly cash flow is $15k ($182k/yr) — positive. Per door: $1k/mo.
- The deal already cash-flows at list — no discount required.
- Meets the 1% rule at list price ($28k rent vs $1.08M).
- Cap rate 23.1% vs local median 3.6% in Stockton — top-decile yield for the area; either an underpriced asset or a hidden risk that comps aren't pricing in. Stress-test before assuming the spread holds.
Location & tenants
- Location reads 57/100 on livability (#734 in CA) — a working-class tenant base; expect higher turnover. Strengths: housing A+, health & safety A, amenities A-; Watch: employment C-, schools D-, crime F.
- Stockton Unified (urban): math 23% / reading 46% proficiency, ranked #295 of 517 in CA (top 57%) — families likely to look elsewhere, expect single-tenant / working-renter base with shorter leases; 78% free/reduced lunch — lower-income household profile, screen leases tightly.
- Market conditions: 64 active listings in the ZIP; 3,779 units permitted in San Joaquin County in 2024 (0 in 5+ unit buildings).
- At $27,725/mo this rent would consume 525% of the median local household income ($63k/yr) (locally 1034% of renters already pay >50% of income on rent) — very limited rent-growth headroom before tenants either downsize or default.
Forward outlook
- Local home prices are declining (-3.0%/yr); year-one equity from $7k of loan paydown is wiped out by about $32k of value loss. Plan a longer hold.
- San Joaquin County population projected at +17% by 2050 — long-run rental-demand tailwind backs the buy-and-hold thesis.
- At projected returns (-3.0% appreciation + 3.0% rent growth), your $302k cash investment doubles in ~2 years — after that, you're playing with house money.
Negotiation context
- Only 11 days on market — expect competitive offers; lowballing is unlikely to land.
- 8 sale attempts since 3y ago; this cycle's ask is 108443% above the opening price — seller raised mid-cycle; expect resistance to lowballs.
- Current owner paid $515k; list at $1.08M implies a 110% gain — meaningful room to come down on a strong offer.
Risks & watch-outs
- Climate carrying-cost: moderate flood risk; extreme-heat days projected 7→15/yr by 2055 (HVAC capex compounding) — expect insurance premiums to compound above CPI over the hold.
Questions for the listing agent
- Can we see the unit-by-unit rent roll, current vacancy, and any below-market leases? What's the average tenancy length?
- What capital expenditures (roof, boiler, parking lot, exteriors) have been made in the last 5 years, and what's planned in the next 2?
- Built in 1976 — when were the roof, HVAC, electrical panel, plumbing, and water heater last replaced?
- Is there a deadline driving the sale (1031 exchange, divorce, estate, relocation)? That informs how much negotiation room exists.
- Schools are D-rated, which usually means shorter tenancies and higher turnover. Who's the typical renter profile here, and what's been the actual vacancy rate?
- Crime grade is F in this area — have there been break-ins, vandalism, or insurance claims at this property in the last 3 years? What carrier currently insures it and at what premium?
- What's the average days-on-market for RENTAL listings here right now (not sales)? A rising rental-DOM trend means longer vacancies and softer asking-rent achievability than the comps imply.
- What's the recent tenant-quality profile in this submarket — average credit score on applications, eviction rate, late-payment / NSF rate, and stable-employment percentage? A property-management company in the area should have these aggregated.
- How much new apartment / multifamily construction is in the pipeline within 1–3 miles? Heavy new supply (>2% of stock underway) typically softens rents 12–24 months out; light construction supports rent growth.
Investment metrics
- 1% rule
- 2.57% ✓
- Cap rate
- 23.11%
- Cash-on-cash
- 60.06%
- DSCR
- 3.67
- GRM
- 3.2
CMA / ARV
No comps found within radius.
Projected returns pro-forma
-3.0% appreciation · 3.0% rent growth · sell at horizon
- IRR
- 58.8%
- Equity multiple
- 3.61×
- Total profit
- $788,984
- Equity at exit
- $161,032
- IRR
- 63.6%
- Equity multiple
- 7.38×
- Total profit
- $1,928,299
- Equity at exit
- $93,379
Cash invested: $302,400 (down + closing). Projections, not guarantees.
Landlord ↔ Tenant lean methodology
- Overall (STATE)
- 18 Strongly Tenant-Friendly
- State California
- 18 Strongly Tenant-Friendly · D+13
- County
- — inherits STATE
- City
- — inherits STATE
ZIP-level market 95203
- Active inventory
- 64
- Price-to-rent
- 48.7×
Monthly cashflow live
- Estimated rent
- $27,725 medium interval (Pro) →
- Mortgage (P&I)
- −$5,664
- Tax from tax record
- −$653 /mo · $7,841/yr
- Insurance
- −$450
- HOA
- −$0
- Vacancy / Maint / Mgmt
- −$5,822
- Net cashflow
- $15,136
Break-even live
15-unit breakdown (identical units grouped — click to expand)
| Units | Beds | Baths | Est. rent |
|---|---|---|---|
| 15× units | 16 | — | $27,720 |
| #1 | 16 | — | $1,848 |
| #2 | 16 | — | $1,848 |
| #3 | 16 | — | $1,848 |
| #4 | 16 | — | $1,848 |
| #5 | 16 | — | $1,848 |
| #6 | 16 | — | $1,848 |
| #7 | 16 | — | $1,848 |
| #8 | 16 | — | $1,848 |
| #9 | 16 | — | $1,848 |
| #10 | 16 | — | $1,848 |
| #11 | 16 | — | $1,848 |
| #12 | 16 | — | $1,848 |
| #13 | 16 | — | $1,848 |
| #14 | 16 | — | $1,848 |
| #15 | 16 | — | $1,848 |
| Total (15 units) | $27,725 | ||
UW: 25.0% down · 7.5% · 30yr · 1.5% tax · 5.0% vac · 8.0% maint · 8.0% mgmt
Financing live
Cash to close
- Down payment
- $270,000
- Closing costs
- $32,400
- Reserves months
- —
- Total cash needed
- —
Loan-product check · same deal, 3 products live
Conventional
25% down · 7.5% · 30yr
- Down + closing
- —
- Monthly P&I
- —
- Monthly cashflow
- —
- DSCR
- —
- Eligible?
- —
Personal DTI + credit; lowest rate.
DSCR
20% down · 8.5% · 30yr
- Down + closing
- —
- Monthly P&I
- —
- Monthly cashflow
- —
- DSCR
- —
- Eligible?
- —
No personal income docs; deal must DSCR.
Hard money
10% down · 12.0% · 12mo
- Down + closing
- —
- Monthly P&I
- —
- Monthly cashflow
- —
- DSCR
- —
- Eligible?
- —
Short-term bridge; refi at stabilization.
Listing history 9 events
-
2026-06-14statusdays on market $1,080,000 Pending 11 DOM
-
2026-06-10days on market $1,080,000 Active 9 DOM
-
2026-06-09days on market $1,080,000 Active 8 DOM
-
2026-06-08days on market $1,080,000 Active 7 DOM
-
2026-06-07days on market $1,080,000 Active 6 DOM
-
2026-06-05days on market $1,080,000 Active 3 DOM
-
2026-06-03days on market $1,080,000 Active 2 DOM
-
2026-06-02remarks 699-char remark
-
2026-06-02$1,080,000 Active 1 DOM
ⓘ Source: listings_history table (triggers on properties + properties_extension) + one-shot
backfill from property_details.listing_events for pre-trigger history.
Tax reassessment forecast CA · Resets to sale price
- Current annual tax
- $7,841 · $653/mo
- Projected year-2 tax
- $8,208 · $684/mo
- Expected delta
- +$367/yr (+$31/mo · 4.7%)
ⓘ Screening estimate from a state-policy table — verify with the county assessor before closing.
Climate risk First Street
- Flood 5/10 Major FEMA zone X · 24% chance over 30 yrs
- Wildfire 1/10 Low
- Heat 7/10 Severe 7 d/yr ≥103°F today · 15 d/yr by 30 yrs out
- Wind 1/10 Low
- Air quality 10/10 Extreme 30 unhealthy d/yr today · 30 by 30 yrs out
Nearby sold comps map
Loading sold comps map…
Walkable amenities ~0.75 mi
Loading nearby amenities…
Taxation est. · year 1
- Rental income
- $332,700
- − Mortgage interest
- −$60,497
- − Property taxes
- −$7,841
- − Insurance
- −$5,400
- − Repairs & maintenance
- −$26,616
- − Management
- −$26,616
- − Depreciation
- −$31,418
- Taxable income
- $174,312
- Est. tax owed @ 24.0%
- −$41,835
- After-tax cash flow
- $139,793/yr
For passive investors: Depreciation is non-cash, so a rental often shows a tax loss while cash-flowing — sheltering income. Rental losses are passive: they offset passive income freely, and up to $25,000/yr can offset ordinary (W-2) income if you actively participate and your MAGI is under $100k (phasing out to $0 by $150k); unused losses carry forward. On sale, claimed depreciation is recaptured at up to 25%, and gains may owe capital-gains tax (a 1031 exchange can defer both). Figures are a year-1 estimate at your 24.0% rate — not tax advice; consult a CPA.
Schools (NCES district)
- District
- Stockton Unified
- NCES district ID
- 0638010
- Math proficiency
- 23% ▲ 2.00%
- Reading proficiency
- 46% ▲ 16.00%
- Median HH income
- $37,563
- Composite
- 28.65/100
- National rank
- #6701
- State rank
- #295 of 517 in CA
Livability — Stockton
- Score
- 57/100
- State rank
- #734
- US rank
- #21638
Category grades
Schools grade is shown separately in the Schools card above.
Census & demographics
- Census place
- Stockton, CA
- County
- San Joaquin County · 729,570 people
- City population
- 332,006
- Metro
- Stockton, CA
- Population (ZIP)
- 15,930
- Household income
- $63,411
- Rent vs Own
- Severe rent burden
- 1034.0
Population outlook (San Joaquin County) Hauer SSP2
- Today (2025)
- 796,965 people
- By 2030
- 828,849 · +4.0%
- By 2040
- 885,611 · +11.1%
- By 2050
- 929,798 · +16.7%
- By 2075
- 994,578 · +24.8%
- By 2100
- 971,291 · +21.9%
Race, ethnicity, and origin ACS 2023
- Neighborhood character
- Diverse neighborhood (Simpson 0.62)
- Race & ethnicity
- Hispanic / Latino 58% White 17% Two or more races 14% Asian 10% Black 9% Native American 5%
- Hispanic origin (detail)
- Mexican 51%
- Common ancestry
- Serbian 1% Lithuanian 1%
- Foreign-born
- 25% · Canada, China
- Languages at home
- 54% English-only · Spanish 38% Other Asian/Pacific 4% Tagalog/Filipino 2%
Political lean MEDSL · San Joaquin
- 2024 margin
- Toss-up / Even · D 48.0% · R 48.9% · Other 3.0%
- 2008→2024 swing
- -11.6pp toward R · 2008: 10.7pp · 2024: -0.9pp
- All cycles
- 2024: R+0.9 2020: D+13.9 2016: D+12.9 2012: D+8.9 2008: D+10.7
Not yet ingested
- Civics
- —
Market trends
- HPI YoY
- ▼ -342.07%
- Current HPI
- 455.9551
- Rent YoY
- —
- Metro
- Stockton, CA
- State GDP YoY
- ▲ 3.21%
- F500 in state
- 116
Industry mix (Fortune 500 HQ in CA)
| Industry | F500 HQs | Revenue |
|---|---|---|
| Technology | 27 | $1,492B |
|
||
| Financial Services | 3 | $174B |
|
||
| Retail | 3 | $44B |
|
||
| Insurance | 3 | $26B |
|
||
| Media / Entertainment | 2 | $115B |
|
||
| Pharmaceuticals / Biotech | 2 | $62B |
|
||
Price history
-99.2% since first listed24 events — show timeline
- 2026-05-07 Listed for Rent $995 RENTEC
- 2026-05-06 Rental Removed $995 RENTEC
- 2026-04-26 Price Changed $995 RENTEC
- 2026-04-01 Listed for Rent $1,095 RENTEC
- 2026-03-23 Rental Removed $1,095 RENTEC
- 2026-03-13 Listed for Rent $1,095 RENTEC
- 2025-12-16 Rental Removed $1,000 RENTEC
- 2025-12-03 Listed for Rent $1,000 RENTEC
- 2025-11-27 Rental Removed $995 RENTEC
- 2025-09-23 Listed for Rent $995 RENTEC
- 2025-09-15 Rental Removed $995 RENTEC
- 2025-09-09 Listed for Rent $995 RENTEC
- 2025-02-05 Rental Removed $1,000 RENTEC
- 2025-01-12 Listed for Rent $1,000 RENTEC
- 2023-08-13 Rental Removed $935 RENTEC
- 2023-07-13 Listed for Rent $935 RENTEC
- 2022-02-07 Price Changed $935 RENT.
- 2015-04-03 Sold (Public Records) $515,000 Public Records
- 2010-11-19 Sold (Public Records) $350,100 Public Records
- 2007-01-16 Sold (Public Records) $775,000 Public Records
- 2006-04-01 Listing Removed — bridgeMLS, Bay East AOR, or Contra Costa AOR
- 2002-07-12 Sold (Public Records) $445,000 Public Records
- 1988-06-21 Sold (Public Records) $60,000 Public Records
- 1982-12-29 Sold (Public Records) $131,000 Public Records
Property tax history
+1.5%/yrLatest (2025): $7,841 · +1.6% YoY. Source: county tax records.
Cash-flow waterfall
monthlySold comps — $/sqft
last 12 mo · ≤1 miLoading sold comps…