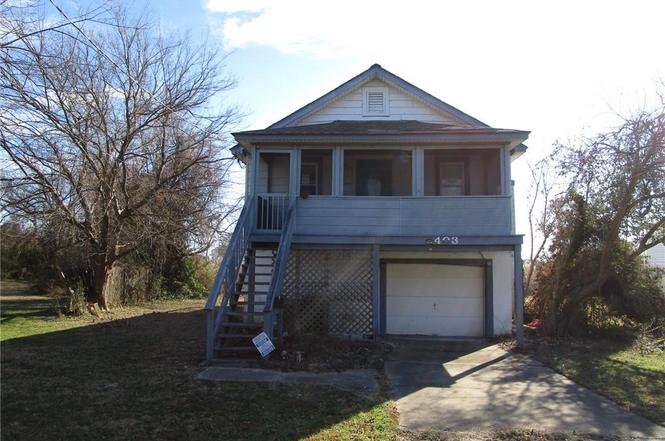
403 Benthall Rd
Hampton, VA 23664
$205,000B-
3 bd · 2.0 ba ·
1,144 sqft ·
Built 1959
· SingleFamily
· Under Contract
· 18 DOM
Cashflow @ list (25.0% down · 7.5%)
Estimated rent
$2,208/mo
Mortgage (P&I)
−$1,075
Tax + insurance
−$739
HOA
−$0
Vac / Maint / Mgmt
−$464
Net cashflow
$-69/mo
Annual
$-832/yr
Cap rate
8.38%
Cash-on-cash
7.47%
DSCR
1.33
1% rule
1.08%
Cash to close
$57,400
Investor read
- This is a 3-bed/2.0-bath single-family listed at $205k.
- At list price, monthly cash flow is $-69 ($-832/yr) — negative.
- To cash-flow at today's rent, offer at most $193k (6.0% below list).
- Meets the 1% rule at list price ($2k rent vs $205k).
- It's been on market 18 days — a 2% lower offer ($202k) is reasonable based on typical stale-listing flexibility.
- Recommended offer: $193k (6.0% below list) — sets the bar for cash-flow.
- Local home prices are declining (-3.0%/yr); year-one equity from $1k of loan paydown is wiped out by about $6k of value loss. Plan a longer hold.
- Location reads 75/100 on livability (#133 in VA, #4,302 nationally) — a middle-class / working-renter tenant base. Strengths: housing A+, health & safety A+, cost of living A; Watch: crime C-, amenities D+, commute F.
- Hampton City Public School District (urban): math 60% / reading 70% proficiency, ranked #40 of 131 in VA (top 30%) — acceptable for families but not a draw, mixed tenant base, ~2y average lease.
- Zoned schools: Mary W. Jackson Elementary (math 72% / reading 77%, grade A, #220 of 1,108 statewide, top 22%, 309 students, 112% FRL); Benjamin Syms Middle (math 62% / reading 64%, grade B+, #134 of 342 statewide, top 40%, 897 students, 69% FRL); Phoebus High (math 57% / reading 76%, grade B, #195 of 319 statewide, top 62%, 1,365 students, 86% FRL) — zoned schools average 89% FRL vs 49% district-wide (40 pts higher); higher-poverty schools than district average — tighter screening recommended.
- Watch-outs: flood insurance adds $427/mo; built in 1959 — expect roof / HVAC / electrical / plumbing capex.
- Market conditions: 97 active listings in the ZIP; 20 comparable units currently listed for rent nearby; rentals at typical pace (median 17d on market — plan ~3-4 weeks tenant-placement turnaround); solid renter incomes; 68 units permitted in Hampton city in 2024 (0 in 5+ unit buildings).
- Hampton County population projected at -13% by 2050 — secular population decline; favor cash flow + early exit over multi-decade hold.
- 3 sale attempts since 9y ago with the ask held roughly flat each time — persistent listings suggest the price (not the market) is what's stuck; bring a comps-based counter.
- Climate carrying-cost: in FEMA flood zone AE (mandatory federal flood insurance); severe wind risk, 80% chance of damaging wind over 30y; extreme-heat days projected 7→17/yr by 2055 (HVAC capex compounding) — expect insurance premiums to compound above CPI over the hold.
- Cap rate 8.4% vs local median 4.5% in Hampton — top-decile yield for the area; either an underpriced asset or a hidden risk that comps aren't pricing in. Stress-test before assuming the spread holds.
- This rent runs 30% of the median local income ($87k/yr) — at the standard rent-burdened threshold; future hikes will face affordability resistance.
Questions for listing agent
- What do current leases actually rent for vs. the listed asking? Can we see a recent rent roll and the last 12 months of T-12 income?
- Built in 1959 — when were the roof, HVAC, electrical panel, plumbing, and water heater last replaced?
- What's the actual annual flood-insurance premium (NFIP or private), and is the property in a SFHA with mandatory coverage?
- Is there a deadline driving the sale (1031 exchange, divorce, estate, relocation)? That informs how much negotiation room exists.
- Schools are B-rated — typically a magnet for longer-tenancy family renters. What's the average tenant stay here, and is there a school-zone premium baked into asking?
- What's the average days-on-market for RENTAL listings here right now (not sales)? A rising rental-DOM trend means longer vacancies and softer asking-rent achievability than the comps imply.
- What's the recent tenant-quality profile in this submarket — average credit score on applications, eviction rate, late-payment / NSF rate, and stable-employment percentage? A property-management company in the area should have these aggregated.
- How much new for-sale + rental construction is in the pipeline within 1–3 miles? Heavy new supply typically softens prices + rents 12–24 months out; constrained supply supports both.
CashFlowRE · CFR-BMPAGR5NWCYP5A
· Data 4 weeks ago
cashflowre.app · 2026-05-29