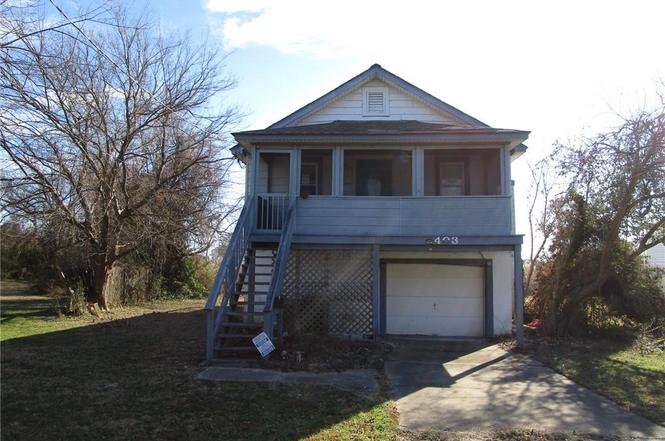
403 Benthall Rd · Hampton, VA
Flood risk 10/10 · Severe
- FEMA flood zone
- AE
- Chance of flooding over 30 yrs
- 0.99%
- Est. flood insurance / yr
- $1,737 – $8,500
Fire risk 1/10 · Minimal
- Est. fire insurance / yr
- $666 – $1,236
Heat risk 9/10 · Severe
- Hot days now (above 105°F)
- 7 days/yr
- Hot days in 30 yrs
- 17 days/yr
Wind risk 8/10 · Major
- Chance of severe wind over 30 yrs
- 80.0%
Air-quality risk 2/10 · Minimal
- Unhealthy air days now
- 1 days/yr
- Unhealthy air days in 30 yrs
- 2 days/yr
Risk factors via First Street. Map © Google.
Why this score? — see what drove the B- grade
The composite is a weighted blend of 9 inputs, each scored 0–100. Each bar is that input's sub-score; the figure is the points it added to the 100-point composite (weight × sub-score).
- Cash flow +23.7/30.0
- ARV discount +15.0/15.0
- DSCR +7.6/10.0
- 1% rule +6.0/10.0
- Schools +5.5/10.0
- Livability +3.8/5.0
- Rent growth +2.5/5.0
- Condition / age +2.5/5.0
- Appreciation +0.0/10.0
$205,000
🖨 Deal sheet (PDF) 📄 Offer letter ✓ Due diligence
Listing remarks
Bungalow home setting on an oversized garage 1000+ square feet, The home features great views of the marsh and Salt Ponds. The home features 3 bedrooms, large great room and a screen front porch and large deck. Located close to Buckroe Beach, military bases, schools, shopping and the interstate. Don't miss out on the great home.
Key facts
- Large deck
- Screen front porch
- 2 garage spots
Tags
Neighborhood map
What this means for you Summary
Snapshot
- This is a 3-bed/2.0-bath single-family listed at $205k.
Deal economics
- At list price, monthly cash flow is $-36 ($-433/yr) — negative.
- To cash-flow at today's rent, offer at most $199k (3.1% below list).
- Meets the 1% rule at list price ($2k rent vs $205k).
- Recommended offer: $199k (3.1% below list) — sets the bar for cash-flow.
- Cap rate 8.6% vs local median 4.5% in Hampton — top-decile yield for the area; either an underpriced asset or a hidden risk that comps aren't pricing in. Stress-test before assuming the spread holds.
Location & tenants
- Location reads 75/100 on livability (#133 in VA, #4,302 nationally) — a middle-class / working-renter tenant base. Strengths: housing A+, health & safety A+, cost of living A; Watch: crime C-, amenities D+, commute F.
- Hampton City Public School District (urban): math 60% / reading 70% proficiency, ranked #40 of 131 in VA (top 30%) — acceptable for families but not a draw, mixed tenant base, ~2y average lease.
- Zoned schools: Mary W. Jackson Elementary (math 72% / reading 77%, grade A, #220 of 1,108 statewide, top 22%, 309 students, 112% FRL); Benjamin Syms Middle (math 62% / reading 64%, grade B+, #134 of 342 statewide, top 40%, 897 students, 69% FRL); Phoebus High (math 57% / reading 76%, grade B, #195 of 319 statewide, top 62%, 1,365 students, 86% FRL) — zoned schools average 89% FRL vs 49% district-wide (40 pts higher); higher-poverty schools than district average — tighter screening recommended.
- Market conditions: 97 active listings in the ZIP; 17 comparable units currently listed for rent nearby; rentals at typical pace (median 26d on market — plan ~3-4 weeks tenant-placement turnaround); 41% of comp listings sitting > 30 days — soft ceiling on asking rent; solid renter incomes; 68 units permitted in Hampton city in 2024 (0 in 5+ unit buildings).
- This rent runs 31% of the median local income ($87k/yr) — at the standard rent-burdened threshold; future hikes will face affordability resistance.
Forward outlook
- Local home prices are declining (-3.0%/yr); year-one equity from $1k of loan paydown is wiped out by about $6k of value loss. Plan a longer hold.
- Hampton County population projected at -13% by 2050 — secular population decline; favor cash flow + early exit over multi-decade hold.
Negotiation context
- It's been on market 18 days — a 2% lower offer ($202k) is reasonable based on typical stale-listing flexibility.
- 3 sale attempts since 9y ago with the ask held roughly flat each time — persistent listings suggest the price (not the market) is what's stuck; bring a comps-based counter.
Risks & watch-outs
- Watch-outs: flood insurance adds $427/mo; built in 1959 — expect roof / HVAC / electrical / plumbing capex.
- Climate carrying-cost: in FEMA flood zone AE (mandatory federal flood insurance); severe wind risk, 80% chance of damaging wind over 30y; extreme-heat days projected 7→17/yr by 2055 (HVAC capex compounding) — expect insurance premiums to compound above CPI over the hold.
Questions for the listing agent
- What do current leases actually rent for vs. the listed asking? Can we see a recent rent roll and the last 12 months of T-12 income?
- Built in 1959 — when were the roof, HVAC, electrical panel, plumbing, and water heater last replaced?
- What's the actual annual flood-insurance premium (NFIP or private), and is the property in a SFHA with mandatory coverage?
- Is there a deadline driving the sale (1031 exchange, divorce, estate, relocation)? That informs how much negotiation room exists.
- Schools are B-rated — typically a magnet for longer-tenancy family renters. What's the average tenant stay here, and is there a school-zone premium baked into asking?
- What's the average days-on-market for RENTAL listings here right now (not sales)? A rising rental-DOM trend means longer vacancies and softer asking-rent achievability than the comps imply.
- What's the recent tenant-quality profile in this submarket — average credit score on applications, eviction rate, late-payment / NSF rate, and stable-employment percentage? A property-management company in the area should have these aggregated.
- How much new for-sale + rental construction is in the pipeline within 1–3 miles? Heavy new supply typically softens prices + rents 12–24 months out; constrained supply supports both.
Investment metrics
- 1% rule
- 1.10% ✓
- Cap rate
- 8.58%
- Cash-on-cash
- 8.16%
- DSCR
- 1.36
- GRM
- 7.6
CMA / ARV
- ARV (on-the-fly)
- $258,544
- Comps found
- 12
Show comp detail 12 sales within ~0.75 mi
| Address | Dist | Beds/Ba | Sqft | Sold | Price | $/sf | Match |
|---|---|---|---|---|---|---|---|
| 403 Benthall Rd | 0.00mi | 3/2.0 | 1,144 (0%) | 1mo | $212,150 | $185 | 99 |
| 419 Rogers Ave | 0.08mi | 3/1.0 | 1,120 (-2%) | 3mo | $156,000 | $139 | 86 |
| 2232 N Mallory St | 0.13mi | 4/1.5 (+1) | 1,232 (+8%) | 0mo | $240,000 | $195 | 74 |
| 300 Richmond Dr | 0.22mi | 3/2.0 | 1,248 (+9%) | 5mo | $255,000 | $204 | 71 |
| 417 Hunlac Ave | 0.13mi | 3/1.5 | 992 (-13%) | 0mo | $286,000 | $288 | 70 |
| 112 S 2nd St | 0.56mi | 3/1.0 | 1,166 (+2%) | 0mo | $345,000 | $296 | 66 |
| 405 Buckroe Ave | 0.54mi | 3/2.0 | 1,200 (+5%) | 2mo | $342,000 | $285 | 65 |
| 2404 Andrews Blvd | 0.72mi | 3/2.0 | 1,212 (+6%) | 0mo | $274,000 | $226 | 56 |
| 220 N Fifth St | 0.36mi | 4/2.5 (+1) | 1,307 (+14%) | 1mo | $100,000 | $77 | 52 |
| 1 Easthill Ct | 0.58mi | 3/2.5 | 1,284 (+12%) | 4mo | $300,000 | $234 | 47 |
| 1914 Zinzer Rd | 0.74mi | 3/2.0 | 1,250 (+9%) | 4mo | $292,000 | $234 | 47 |
| 1622 Old Buckroe Rd | 0.67mi | 3/1.0 | 1,009 (-12%) | 2mo | $228,000 | $226 | 43 |
Match score weights: distance 35% · size 25% · config 20% · recency 20%. Top-matched comps best support the ARV.
Projected returns pro-forma
-3.0% appreciation · 3.0% rent growth · sell at horizon
- IRR
- -17.4%
- Equity multiple
- 0.39×
- Total profit
- $-35,241
- Equity at exit
- $30,566
- IRR
- -9.1%
- Equity multiple
- 0.43×
- Total profit
- $-32,520
- Equity at exit
- $17,725
Cash invested: $57,400 (down + closing). Projections, not guarantees.
Landlord ↔ Tenant lean methodology
- Overall (STATE)
- 55 Moderately Landlord-Leaning
- State Virginia
- 55 Moderately Landlord-Leaning · D+2
- County
- — inherits STATE
- City
- — inherits STATE
ZIP-level market 23664
- Home prices YoY
- -23.6%
- Active inventory
- 97
- Price-to-rent
- 7.6×
Monthly cashflow live
- Estimated rent
- $2,250 high interval (Pro) →
- Mortgage (P&I)
- −$1,075
- Tax from tax record
- −$227 /mo · $2,721/yr
- Insurance
- −$85
- Flood insurance flood zone
- −$427 /mo · $5,118/yr
- HOA
- −$0
- Vacancy / Maint / Mgmt
- −$473
- Net cashflow
- $-36
Break-even live
Sensitivity live
| Price | -10% $80 | -5% $22 | +0% $-36 | +5% $-94 | +10% $-152 |
|---|---|---|---|---|---|
| Rent | -10% $-214 | -5% $-125 | +0% $-36 | +5% $53 | +10% $142 |
| Rate | -1.0pp $67 | -0.5pp $16 | base $-36 | +0.5pp $-89 | +1.0pp $-143 |
UW: 25.0% down · 7.5% · 30yr · 1.5% tax · 5.0% vac · 8.0% maint · 8.0% mgmt
Financing live
Cash to close
- Down payment
- $51,250
- Closing costs
- $6,150
- Reserves months
- —
- Total cash needed
- —
Loan-product check · same deal, 3 products live
Conventional
25% down · 7.5% · 30yr
- Down + closing
- —
- Monthly P&I
- —
- Monthly cashflow
- —
- DSCR
- —
- Eligible?
- —
Personal DTI + credit; lowest rate.
DSCR
20% down · 8.5% · 30yr
- Down + closing
- —
- Monthly P&I
- —
- Monthly cashflow
- —
- DSCR
- —
- Eligible?
- —
No personal income docs; deal must DSCR.
Hard money
10% down · 12.0% · 12mo
- Down + closing
- —
- Monthly P&I
- —
- Monthly cashflow
- —
- DSCR
- —
- Eligible?
- —
Short-term bridge; refi at stabilization.
Rent comps 17 comps
| Address | Beds | Baths | Sqft | Rent | $/sqft | DOM | Units | Dist |
|---|---|---|---|---|---|---|---|---|
| 1026 High Dunes Quay Hampton, VA | 3.0 | 2.0 | 1216 | $2,100 | $1.73 | 25d | 1 | 0.29mi |
| 334 N 1st St Hampton, VA | 2.0 | 1.5 | 1200 | $2,495 | $2.08 | 16d | 1 | 0.31mi |
| 203 N First St Unit A Hampton, VA | 2.0 | 1.5 | 1406 | $2,900 | $2.06 | 45d | 1 | 0.39mi |
| 216 S 2nd St Hampton, VA | 2.0 | 2.0 | 1429 | $2,395 | $1.68 | 23d | 1 | 0.69mi |
| 2304 Burnette Dr Hampton, VA | 4.0 | 2.0 | 1322 | $2,100 | $1.59 | 16d | 1 | 0.73mi |
| 102 Silver Isles Blvd Hampton, VA | 3.0 | 2.0 | 1025 | $1,900 | $1.85 | 45d | 1 | 0.77mi |
| 1805 Nickerson Blvd Hampton, VA | 3.0 | 1.5 | 1393 | $1,695 | $1.22 | 45d | 1 | 0.83mi |
| 229 Atlantic Ave Hampton, VA | 2.0 | 1.0 | 1170 | $1,600 | $1.37 | 14d | 1 | 0.90mi |
| 1665 N Mallory St Hampton, VA | 2.0 | 1.0 | 1250 | $1,785 | $1.43 | 45d | 1 | 0.93mi |
| 44 Glenhaven Dr Hampton, VA | 3.0 | 2.0 | 1410 | $2,500 | $1.77 | 16d | 1 | 0.93mi |
| 10 Westlawn Dr Hampton, VA | 3.0 | 2.0 | 1463 | $2,295 | $1.57 | 25d | 1 | 0.98mi |
| 2010 E Pembroke Ave Hampton, VA | 2.0 | 1.0 | 900 | $1,150 | $1.28 | 6d | 1 | 1.01mi |
| 29 Glascow Way Hampton, VA | 3.0 | 1.5 | 1382 | $2,200 | $1.59 | 16d | 1 | 1.24mi |
| 2000 Neville Cir Hampton, VA | 3.0 | 1.0 | 1100 | $1,750 | $1.59 | 45d | 1 | 1.27mi |
| 244 Loch Cir Hampton, VA | 3.0 | 2.5 | 1440 | $1,850 | $1.28 | 45d | 1 | 1.37mi |
| 633 Kings View Ct Hampton, VA | 3.0 | 1.0 | 865 | $1,700 | $1.97 | 45d | 1 | 1.37mi |
| 2001 Grimes Rd Hampton, VA | 4.0 | 2.0 | 1430 | $2,100 | $1.47 | 4d | 1 | 1.47mi |
Listing history 9 events
-
2026-03-02status Under Contract
-
2026-02-19status Active
-
2026-01-20status Under Contract
-
2026-01-12$205,000 Active
-
2017-12-15soldstatus $195,000
-
2017-11-08status Under Contract
-
2017-08-02$190,000 Active
-
1993-07-01soldstatus $88,500
-
1990-11-01soldstatus $79,600
ⓘ Source: listings_history table (triggers on properties + properties_extension) + one-shot
backfill from property_details.listing_events for pre-trigger history.
Tax reassessment forecast VA · Resets to sale price
- Current annual tax
- $2,721 · $227/mo
- Projected year-2 tax
- $2,721 · $227/mo
- Expected delta
- $0/yr ($0/mo · 0.0%)
ⓘ Screening estimate from a state-policy table — verify with the county assessor before closing.
Climate risk First Street
- Flood 10/10 Extreme FEMA zone AE · 99% chance over 30 yrs
- Wildfire 1/10 Low
- Heat 9/10 Extreme 7 d/yr ≥105°F today · 17 d/yr by 30 yrs out
- Wind 8/10 Severe 80% chance of damaging wind over 30 yrs
- Air quality 2/10 Low 1 unhealthy d/yr today · 2 by 30 yrs out
Nearby sold comps map
Loading sold comps map…
Walkable amenities ~0.75 mi
Loading nearby amenities…
Taxation est. · year 1
- Rental income
- $27,002
- − Mortgage interest
- −$11,483
- − Property taxes
- −$2,721
- − Insurance
- −$6,144
- − Repairs & maintenance
- −$2,160
- − Management
- −$2,160
- − Depreciation
- −$5,964
- Taxable loss
- −$3,630
- Est. tax savings @ 24.0%
- +$871
- After-tax cash flow
- $438/yr
For passive investors: Depreciation is non-cash, so a rental often shows a tax loss while cash-flowing — sheltering income. Rental losses are passive: they offset passive income freely, and up to $25,000/yr can offset ordinary (W-2) income if you actively participate and your MAGI is under $100k (phasing out to $0 by $150k); unused losses carry forward. On sale, claimed depreciation is recaptured at up to 25%, and gains may owe capital-gains tax (a 1031 exchange can defer both). Figures are a year-1 estimate at your 24.0% rate — not tax advice; consult a CPA.
Schools (NCES district)
- District
- Hampton City Public School District
- NCES district ID
- 5101800
- Math proficiency
- 60% ▼ -21.00%
- Reading proficiency
- 70% ▼ -4.00%
- Median HH income
- $50,089
- Composite
- 55.19/100
- National rank
- #1272
- State rank
- #40 of 131 in VA
Livability — Hampton
- Score
- 75/100
- State rank
- #133
- US rank
- #4302
Category grades
Schools grade is shown separately in the Schools card above.
Census & demographics
- Census place
- Hampton, VA
- County
- Hampton City · 132,421 people
- City population
- 132,421
- Metro
- Virginia Beach-Norfolk-Newport News, VA-NC
- Population (ZIP)
- 9,643
- Household income
- $87,412
- Rent vs Own
- Severe rent burden
- 394.0
Population outlook (Hampton County) Hauer SSP2
- Today (2025)
- 134,055 people
- By 2030
- 131,753 · -1.7%
- By 2040
- 125,017 · -6.7%
- By 2050
- 116,825 · -12.9%
- By 2075
- 97,033 · -27.6%
- By 2100
- 76,188 · -43.2%
Race, ethnicity, and origin ACS 2023
- Neighborhood character
- Predominantly White (67%)
- Race & ethnicity
- White 67% Black 24% Two or more races 4% Hispanic / Latino 3%
- Common ancestry
- Slovak 2% Lithuanian 2% Italian 2%
- Foreign-born
- 3% · Canada, Guatemala
- Languages at home
- 97% English-only · Arabic 1% Spanish 1%
Political lean MEDSL · Hampton
- 2024 margin
- Solid D (+39.9) · D 69.2% · R 29.4% · Other 1.4%
- 2008→2024 swing
- +1.0pp no change · 2008: 38.9pp · 2024: 39.9pp
- All cycles
- 2024: D+39.9 2020: D+42.2 2016: D+37.8 2012: D+45.4 2008: D+38.9
Not yet ingested
- Civics
- —
Market trends
- HPI YoY
- ▼ -73.71%
- Current HPI
- 238.491
- Rent YoY
- —
- Metro
- Virginia Beach-Norfolk-Newport News, VA-NC
- State GDP YoY
- ▲ 2.40%
- F500 in state
- 50
Industry mix (Fortune 500 HQ in VA)
| Industry | F500 HQs | Revenue |
|---|---|---|
| Aerospace / Defense | 4 | $236B |
|
||
| Technology / Defense | 3 | $32B |
|
||
| Financial Services | 2 | $176B |
|
||
| Utilities | 2 | $27B |
|
||
| Insurance | 2 | $25B |
|
||
| Technology | 2 | $15B |
|
||
Price history
+157.5% since first listed9 events — show timeline
- 2026-03-02 Pending — REINMLS
- 2026-02-19 Relisted — REINMLS
- 2026-01-20 Pending — REINMLS
- 2026-01-12 Listed $205,000 REINMLS
- 2017-12-15 Sold (Public Records) $195,000 Public Records
- 2017-11-08 Pending — REINMLS
- 2017-08-02 Listed $190,000 REINMLS
- 1993-07-01 Sold (Public Records) $88,500 Public Records
- 1990-11-01 Sold (Public Records) $79,600 Public Records
Property tax history
+7.4%/yrLatest (2025): $2,721 · +7.3% YoY. Source: county tax records.
Cash-flow waterfall
monthlySold comps — $/sqft
last 12 mo · ≤1 miLoading sold comps…