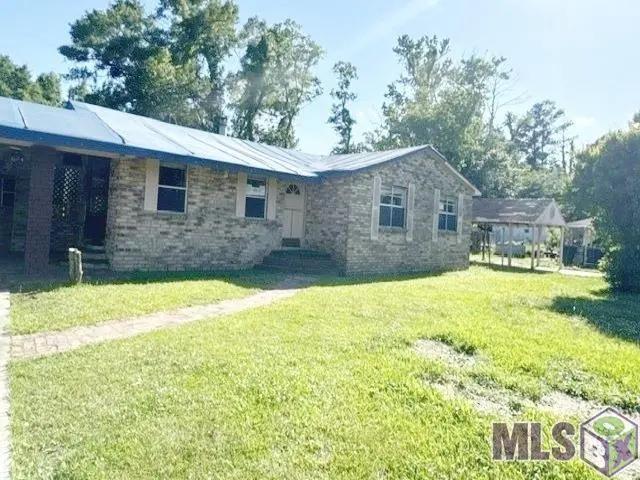
43491 John Ealy Rd
Port Vincent, LA 70769
$69,900B
3 bd · 1.0 ba ·
1,391 sqft ·
Built 1960
· Land
· Active
· 29 DOM
Cashflow @ list (25.0% down · 7.5%)
Estimated rent
$1,954/mo
Mortgage (P&I)
−$367
Tax + insurance
−$543
HOA
−$0
Vac / Maint / Mgmt
−$410
Net cashflow
$634/mo
Annual
$7,611/yr
Cap rate
24.50%
Cash-on-cash
65.04%
DSCR
3.89
1% rule
2.80%
Cash to close
$19,572
Investor read
- This is a 3-bed/1.0-bath land listed at $70k.
- At list price, monthly cash flow is $634 ($8k/yr) — positive.
- The deal already cash-flows at list — no discount required.
- Meets the 1% rule at list price ($2k rent vs $70k).
- It's been on market 29 days — a 2% lower offer ($69k) is reasonable based on typical stale-listing flexibility.
- Recommended offer: $69k (1.5% below list) — sets the bar for market timing.
- Local home prices are declining (-3.0%/yr); year-one equity from $483 of loan paydown is wiped out by about $2k of value loss. Plan a longer hold.
- Location reads 65/100 on livability (#142 in LA) — a middle-class / working-renter tenant base. Strengths: housing A+, health & safety A+, cost of living A; Watch: schools F, amenities F, commute F.
- Ascension Parish (suburban): math 48% / reading 58% proficiency, ranked #7 of 98 in LA (top 7%) — acceptable for families but not a draw, mixed tenant base, ~2y average lease.
- Watch-outs: flood insurance adds $427/mo.
- Market conditions: Rents rising (+3.5%/yr); 492 active listings in the ZIP; solid renter incomes; 579 units permitted in Ascension Parish in 2024 (0 in 5+ unit buildings).
- Ascension County population projected at +43% by 2050 — long-run rental-demand tailwind backs the buy-and-hold thesis.
- 4 sale attempts; this cycle's ask has dropped $10k (13%) from the opening price — seller is motivated, your offer sets the floor, not the list.
- At projected returns (-3.0% appreciation + 3.5% rent growth), your $20k cash investment doubles in ~3 years — after that, you're playing with house money.
- Climate carrying-cost: in FEMA flood zone AE (mandatory federal flood insurance); severe wind risk, 99% chance of damaging wind over 30y; extreme-heat days projected 7→21/yr by 2055 (HVAC capex compounding) — expect insurance premiums to compound above CPI over the hold.
- Cap rate 24.5% vs local median 4.3% in Port Vincent — top-decile yield for the area; either an underpriced asset or a hidden risk that comps aren't pricing in. Stress-test before assuming the spread holds.
Questions for listing agent
- Built in 1960 — when were the roof, HVAC, electrical panel, plumbing, and water heater last replaced?
- What's the actual annual flood-insurance premium (NFIP or private), and is the property in a SFHA with mandatory coverage?
- Is there a deadline driving the sale (1031 exchange, divorce, estate, relocation)? That informs how much negotiation room exists.
- Schools are F-rated, which usually means shorter tenancies and higher turnover. Who's the typical renter profile here, and what's been the actual vacancy rate?
- What's the average days-on-market for RENTAL listings here right now (not sales)? A rising rental-DOM trend means longer vacancies and softer asking-rent achievability than the comps imply.
- What's the recent tenant-quality profile in this submarket — average credit score on applications, eviction rate, late-payment / NSF rate, and stable-employment percentage? A property-management company in the area should have these aggregated.
- How much new for-sale + rental construction is in the pipeline within 1–3 miles? Heavy new supply typically softens prices + rents 12–24 months out; constrained supply supports both.
CashFlowRE · CFR-BNAD4VBA7H1T0N
· Data 2 days ago
cashflowre.app · 2026-05-29