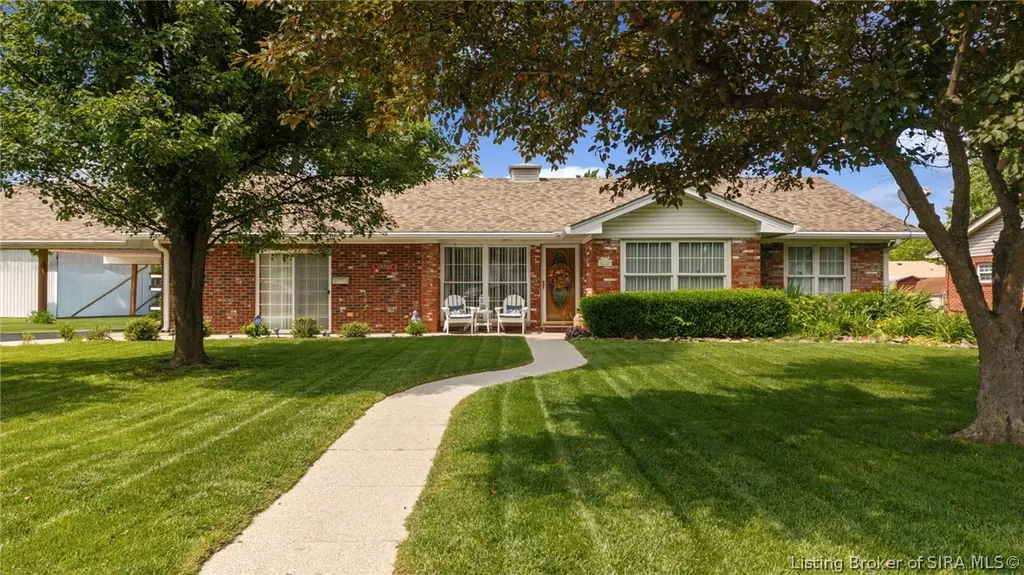
772 Lucas St
Scottsburg, IN 47170
$1F
3 bd · 2.0 ba ·
1,568 sqft ·
Built 1960
· SingleFamily
· Active
· 6 DOM
Cashflow @ list (25.0% down · 7.5%)
Estimated rent
$1,200/mo
Mortgage (P&I)
−$1,307
Tax + insurance
−$416
HOA
−$0
Vac / Maint / Mgmt
−$252
Net cashflow
$-775/mo
Annual
$-9,299/yr
Cap rate
2.56%
Cash-on-cash
-13.32%
DSCR
0.41
1% rule
0.48%
Cash to close
$69,807
Investor read
- This is a 3-bed/2.0-bath single-family listed at $1.
- At list price, monthly cash flow is $-775 ($-9k/yr) — negative.
- The deal already cash-flows at list — no discount required.
- Meets the 1% rule at list price ($1k rent vs $1).
- Only 6 days on market — expect competitive offers; lowballing is unlikely to land.
- Local home prices are declining (-3.0%/yr); year-one equity from $2k of loan paydown is wiped out by about $7k of value loss. Plan a longer hold.
- Location reads 70/100 on livability (#152 in IN) — a middle-class / working-renter tenant base. Strengths: cost of living A+, health & safety A+, housing A; Watch: amenities F, commute F, employment D-.
- Scott County School District 2 (town): math 33% / reading 43% proficiency, ranked #166 of 301 in IN (top 55%) — families likely to look elsewhere, expect single-tenant / working-renter base with shorter leases.
- Watch-outs: property tax is 373968.0% of price.
- Market conditions: 106 active listings in the ZIP; 1 comparable units currently listed for rent nearby; 73 units permitted in Scott County in 2024 (0 in 5+ unit buildings).
- Scott County population projected at -23% by 2050 — secular population decline; favor cash flow + early exit over multi-decade hold.
- Climate carrying-cost: extreme-heat days projected 7→20/yr by 2055 (HVAC capex compounding) — expect insurance premiums to compound above CPI over the hold.
- Cap rate 2.6% vs local median 4.1% in Scottsburg — below-typical yield; the buyer is paying a premium for something (appreciation thesis, condition, location) that the cap rate doesn't capture.
Questions for listing agent
- What do current leases actually rent for vs. the listed asking? Can we see a recent rent roll and the last 12 months of T-12 income?
- Built in 1960 — when were the roof, HVAC, electrical panel, plumbing, and water heater last replaced?
- Property tax is high relative to price — has the assessment been appealed recently, and will the sale trigger a re-assessment?
- Is there a deadline driving the sale (1031 exchange, divorce, estate, relocation)? That informs how much negotiation room exists.
- The area grade is low — what's the realistic commute time and amenity access for the typical tenant pool here? Any planned neighborhood developments (good or bad) we should know about?
- What's the average days-on-market for RENTAL listings here right now (not sales)? A rising rental-DOM trend means longer vacancies and softer asking-rent achievability than the comps imply.
- What's the recent tenant-quality profile in this submarket — average credit score on applications, eviction rate, late-payment / NSF rate, and stable-employment percentage? A property-management company in the area should have these aggregated.
- How much new for-sale + rental construction is in the pipeline within 1–3 miles? Heavy new supply typically softens prices + rents 12–24 months out; constrained supply supports both.
CashFlowRE · CFR-BNC28PCRTBQXZ0
· Data 2 days ago
cashflowre.app · 2026-05-29