 🔨 Auction
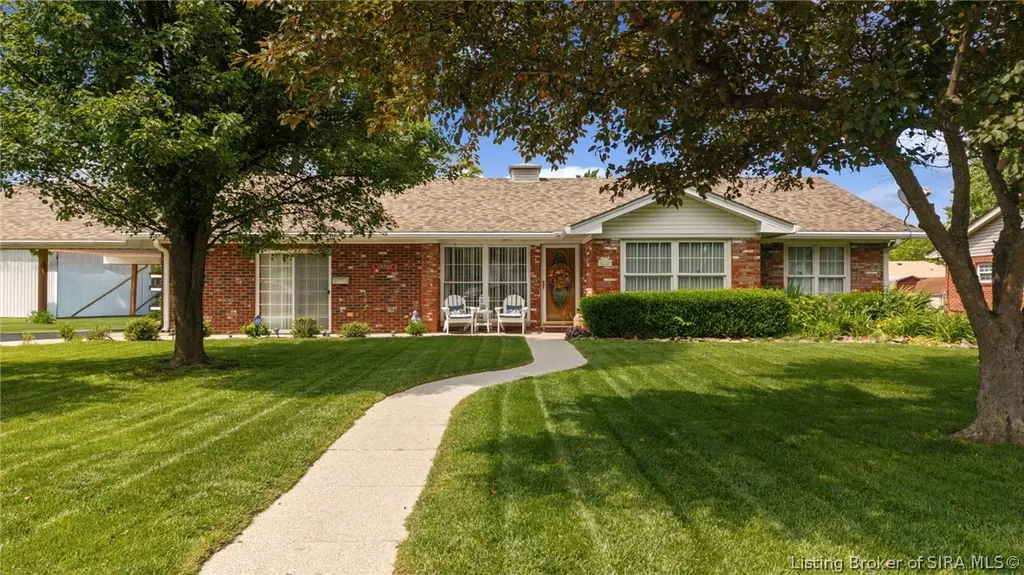
772 Lucas St · Scottsburg, IN
Flood risk 1/10 · Minimal
- FEMA flood zone
- X (unshaded)
- Chance of flooding over 30 yrs
- 0.0%
- Est. flood insurance / yr
- $507 – $1,088
Fire risk 1/10 · Minimal
- Est. fire insurance / yr
- $717 – $1,331
Heat risk 5/10 · Moderate
- Hot days now (above 105°F)
- 7 days/yr
- Hot days in 30 yrs
- 20 days/yr
Wind risk 2/10 · Minimal
- Chance of severe wind over 30 yrs
- 1.0%
Air-quality risk 2/10 · Minimal
- Unhealthy air days now
- 0 days/yr
- Unhealthy air days in 30 yrs
- 1 days/yr
Risk factors via First Street. Map © Google.
Why this score? — see what drove the F grade
The composite is a weighted blend of 9 inputs, each scored 0–100. Each bar is that input's sub-score; the figure is the points it added to the 100-point composite (weight × sub-score).
- ARV discount +7.5/15.0
- Livability +3.5/5.0
- Cash flow +3.3/30.0
- Schools +3.2/10.0
- Rent growth +2.5/5.0
- Condition / age +2.5/5.0
- 1% rule +0.0/10.0
- DSCR +0.0/10.0
- Appreciation +0.0/10.0
$1
🖨 Deal sheet 📄 Offer letter ✓ Due diligence
Listing remarks
Welcome home! This well-maintained brick ranch offering 1,568 sq. ft. of comfortable living space will be offered at AUCTION on 6/27/26 (Tobias Auction Service). The home is offered with a reserve. This home features a spacious living room, 3 generously sized bedrooms with large closets and ceiling fans, and 2 full bathrooms. The kitchen and dining area showcase granite countertops, stainless steel appliances, a gas range, and ample cabinet space. The refrigerator and dishwasher are included. The utility room includes a front-load stainless steel washer and dryer that will remain with the home. One full bath features a walk-in shower, while the second offers a Safe Step walk-in tub and gra
Key facts
- Ample cabinet space
- Granite countertops
- Gas range
Tags
Property features AI
Finance
- HOA & community: Sidewalks
Exterior
- Parking: Attached garage; 1-car garage; Carport
- Utilities: Public water connected; Public sewer
- Home design: Resale property; Above-grade finished living area reported
- Construction: Brick construction
- Exterior features: Enclosed porch; Covered patio; Screened porch; Patio; Paved driveway; Yard fenced; Fence
Interior
- Kitchen: Dishwasher; Oven; Range; Refrigerator
- Bathrooms: 2 full bathrooms
- Heating & cooling: Central air; Heat pump; Forced air heating
- Interior features: Ceiling fans; Main-level primary bedroom; Utility room
- Laundry & utility: Washer; Dryer
Neighborhood map
What this means for you Summary
Snapshot
- This is a 3-bed/2.0-bath single-family listed at $1.
Deal economics
- At list price, monthly cash flow is $-775 ($-9k/yr) — negative.
- The deal already cash-flows at list — no discount required.
- Meets the 1% rule at list price ($1k rent vs $1).
- Cap rate 2.6% vs local median 4.1% in Scottsburg — below-typical yield; the buyer is paying a premium for something (appreciation thesis, condition, location) that the cap rate doesn't capture.
Location & tenants
- Location reads 70/100 on livability (#152 in IN) — a middle-class / working-renter tenant base. Strengths: cost of living A+, health & safety A+, housing A; Watch: amenities F, commute F, employment D-.
- Scott County School District 2 (town): math 33% / reading 43% proficiency, ranked #166 of 301 in IN (top 55%) — families likely to look elsewhere, expect single-tenant / working-renter base with shorter leases.
- Market conditions: 106 active listings in the ZIP; 1 comparable units currently listed for rent nearby; 73 units permitted in Scott County in 2024 (0 in 5+ unit buildings).
Forward outlook
- Local home prices are declining (-3.0%/yr); year-one equity from $2k of loan paydown is wiped out by about $7k of value loss. Plan a longer hold.
- Scott County population projected at -23% by 2050 — secular population decline; favor cash flow + early exit over multi-decade hold.
Negotiation context
- Only 6 days on market — expect competitive offers; lowballing is unlikely to land.
Risks & watch-outs
- Watch-outs: property tax is 373968.0% of price.
- Climate carrying-cost: extreme-heat days projected 7→20/yr by 2055 (HVAC capex compounding) — expect insurance premiums to compound above CPI over the hold.
Questions for the listing agent
- What do current leases actually rent for vs. the listed asking? Can we see a recent rent roll and the last 12 months of T-12 income?
- Built in 1960 — when were the roof, HVAC, electrical panel, plumbing, and water heater last replaced?
- Property tax is high relative to price — has the assessment been appealed recently, and will the sale trigger a re-assessment?
- Is there a deadline driving the sale (1031 exchange, divorce, estate, relocation)? That informs how much negotiation room exists.
- The area grade is low — what's the realistic commute time and amenity access for the typical tenant pool here? Any planned neighborhood developments (good or bad) we should know about?
- What's the average days-on-market for RENTAL listings here right now (not sales)? A rising rental-DOM trend means longer vacancies and softer asking-rent achievability than the comps imply.
- What's the recent tenant-quality profile in this submarket — average credit score on applications, eviction rate, late-payment / NSF rate, and stable-employment percentage? A property-management company in the area should have these aggregated.
- How much new for-sale + rental construction is in the pipeline within 1–3 miles? Heavy new supply typically softens prices + rents 12–24 months out; constrained supply supports both.
Investment metrics
- 1% rule
- 0.48% ✗
- Cap rate
- 2.56%
- Cash-on-cash
- -13.32%
- DSCR
- 0.41
- GRM
- 17.3
CMA / ARV
- ARV (on-the-fly)
- $249,312
- Comps found
- 12
Show comp detail 12 sales within ~0.75 mi
| Address | Dist | Beds/Ba | Sqft | Sold | Price | $/sf | Match |
|---|---|---|---|---|---|---|---|
| 1114 N Pine St | 0.16mi | 3/2.0 | 1,400 (-11%) | 3mo | $225,500 | $161 | 72 |
| 1230 Woodland Ave | 0.55mi | 3/2.0 | 1,587 (+1%) | 3mo | $252,500 | $159 | 70 |
| 1225 Ironwood Pass Ave | 0.53mi | 3/2.0 | 1,580 (+1%) | 6mo | $255,000 | $161 | 69 |
| 901 Lakeview Dr | 0.27mi | 2/2.0 (-1) | 1,648 (+5%) | 7mo | $135,000 | $82 | 68 |
| 1118 W Carla Ln | 0.61mi | 3/1.5 | 1,512 (-4%) | 3mo | $235,000 | $155 | 61 |
| 1239 Rolling Meadows Ct | 0.43mi | 3/2.0 | 1,400 (-11%) | 6mo | $215,000 | $154 | 57 |
| 127 Keith St | 0.57mi | 3/2.0 | 1,716 (+9%) | 1mo | $190,000 | $111 | 57 |
| 1236 Woodland Ave | 0.55mi | 3/2.0 | 1,434 (-8%) | 4mo | $225,000 | $157 | 56 |
| 1237 Woodland Ave | 0.58mi | 3/2.0 | 1,417 (-10%) | 6mo | $229,750 | $162 | 52 |
| 1229 Ironwood Pass Ave | 0.54mi | 3/2.0 | 1,400 (-11%) | 6mo | $238,900 | $171 | 52 |
| 1231 Woodland Ave | 0.57mi | 3/2.0 | 1,417 (-10%) | 7mo | $224,900 | $159 | 52 |
| 155 N Gardner St | 0.52mi | 3/1.0 | 1,341 (-14%) | 4mo | $139,000 | $104 | 44 |
Match score weights: distance 35% · size 25% · config 20% · recency 20%. Top-matched comps best support the ARV.
Projected returns pro-forma
-3.0% appreciation · 3.0% rent growth · sell at horizon
- IRR
- -41.3%
- Equity multiple
- -0.29×
- Total profit
- $-89,737
- Equity at exit
- $37,173
- IRR
- -68.4%
- Equity multiple
- -1.03×
- Total profit
- $-141,622
- Equity at exit
- $21,556
Cash invested: $69,807 (down + closing). Projections, not guarantees.
Landlord ↔ Tenant lean methodology
- Overall (STATE)
- 90 Strongly Landlord-Friendly
- State Indiana
- 90 Strongly Landlord-Friendly · R+11
- County
- — inherits STATE
- City
- — inherits STATE
ZIP-level market 47170
- Home prices YoY
- -22.3%
- Active inventory
- 106
Monthly cashflow live
- Estimated rent
- $1,200 medium interval (Pro) →
- Mortgage (P&I)
- −$1,307
- Tax est. 1.5%
- −$312 /mo · $3,740/yr
- Insurance
- −$104
- HOA
- −$0
- Vacancy / Maint / Mgmt
- −$252
- Net cashflow
- $-775
Break-even live
UW: 25.0% down · 7.5% · 30yr · 1.5% tax · 5.0% vac · 8.0% maint · 8.0% mgmt
Financing live
Cash to close
- Down payment
- $62,328
- Closing costs
- $7,479
- Reserves months
- —
- Total cash needed
- —
Loan-product check · same deal, 3 products live
Conventional
25% down · 7.5% · 30yr
- Down + closing
- —
- Monthly P&I
- —
- Monthly cashflow
- —
- DSCR
- —
- Eligible?
- —
Personal DTI + credit; lowest rate.
DSCR
20% down · 8.5% · 30yr
- Down + closing
- —
- Monthly P&I
- —
- Monthly cashflow
- —
- DSCR
- —
- Eligible?
- —
No personal income docs; deal must DSCR.
Hard money
10% down · 12.0% · 12mo
- Down + closing
- —
- Monthly P&I
- —
- Monthly cashflow
- —
- DSCR
- —
- Eligible?
- —
Short-term bridge; refi at stabilization.
Rent comps 1 comps
| Address | Beds | Baths | Sqft | Rent | $/sqft | DOM | Units | Dist |
|---|---|---|---|---|---|---|---|---|
| 432 N Meridian St Scottsburg, IN | 3.0 | 2.0 | 1300 | $1,200 | $0.92 | 43d | 1 | 0.51mi |
Listing history 6 events
-
2026-06-18days on market $1 Active 6 DOM
-
2026-06-17days on market $1 Active 5 DOM
-
2026-06-16days on market $1 Active 4 DOM
-
2026-06-15days on market $1 Active 3 DOM
-
2026-06-12remarks 699-char remark
-
2026-06-12$1 Active 1 DOM
ⓘ Source: listings_history table (triggers on properties + properties_extension) + one-shot
backfill from property_details.listing_events for pre-trigger history.
Climate risk First Street
- Flood 1/10 Low FEMA zone X (unshaded) · 0% chance over 30 yrs
- Wildfire 1/10 Low
- Heat 5/10 Major 7 d/yr ≥105°F today · 20 d/yr by 30 yrs out
- Wind 2/10 Low 100% chance of damaging wind over 30 yrs
- Air quality 2/10 Low 0 unhealthy d/yr today · 1 by 30 yrs out
Nearby sold comps map
Loading sold comps map…
Walkable amenities ~0.75 mi
Loading nearby amenities…
Taxation est. · year 1
- Rental income
- $14,400
- − Mortgage interest
- −$13,965
- − Property taxes
- −$3,740
- − Insurance
- −$1,247
- − Repairs & maintenance
- −$1,152
- − Management
- −$1,152
- − Depreciation
- −$7,253
- Taxable loss
- −$14,108
- Est. tax savings @ 24.0%
- +$3,386
- After-tax cash flow
- $-5,913/yr
For passive investors: Depreciation is non-cash, so a rental often shows a tax loss while cash-flowing — sheltering income. Rental losses are passive: they offset passive income freely, and up to $25,000/yr can offset ordinary (W-2) income if you actively participate and your MAGI is under $100k (phasing out to $0 by $150k); unused losses carry forward. On sale, claimed depreciation is recaptured at up to 25%, and gains may owe capital-gains tax (a 1031 exchange can defer both). Figures are a year-1 estimate at your 24.0% rate — not tax advice; consult a CPA.
Schools (NCES district)
- District
- Scott County School District 2
- NCES district ID
- 1810020
- Math proficiency
- 33% ▼ -10.00%
- Reading proficiency
- 43% ▼ -6.00%
- Median HH income
- $45,529
- Composite
- 32.37/100
- National rank
- #5734
- State rank
- #166 of 301 in IN
Livability — Scottsburg
- Score
- 70/100
- State rank
- #152
- US rank
- #7609
Category grades
Schools grade is shown separately in the Schools card above.
Census & demographics
- Census place
- Scottsburg, IN
- Population (ZIP)
- 15,279
Population outlook (Scott County) Hauer SSP2
- Today (2025)
- 22,525 people
- By 2030
- 21,609 · -4.1%
- By 2040
- 19,536 · -13.3%
- By 2050
- 17,370 · -22.9%
- By 2075
- 12,862 · -42.9%
- By 2100
- 9,340 · -58.5%
Race, ethnicity, and origin ACS 2023
- Neighborhood character
- Predominantly White (92%)
- Race & ethnicity
- White 92% Two or more races 4% Hispanic / Latino 3%
- Common ancestry
- Slovak 2% Lithuanian 1% Italian 1%
- Foreign-born
- 1% · Canada
- Languages at home
- 97% English-only · Spanish 1% Other Indo-European 1%
Political lean MEDSL · Scott
- 2024 margin
- Solid R (+51.5) · D 23.4% · R 74.9% · Other 1.6%
- 2008→2024 swing
- -49.5pp toward R · 2008: -2.0pp · 2024: -51.5pp
- All cycles
- 2024: R+51.5 2020: R+45.6 2016: R+37.9 2012: R+6.2 2008: R+2.0
Not yet ingested
- Civics
- —
Market trends
- HPI YoY
- ▼ -64.30%
- Current HPI
- 223.9909
- Rent YoY
- —
- Metro
- —
- State GDP YoY
- ▲ 2.90%
- F500 in state
- 18
Industry mix (Fortune 500 HQ in IN)
| Industry | F500 HQs | Revenue |
|---|---|---|
| Industrial Machinery | 2 | $37B |
|
||
| Healthcare | 1 | $177B |
|
||
| Pharmaceuticals | 1 | $45B |
|
||
| Metals / Steel | 1 | $18B |
|
||
| Agriculture | 1 | $17B |
|
||
| Packaging | 1 | $12B |
|
||
Property tax history
+4.2%/yrLatest (2024): $551 · -0.5% YoY. Source: county tax records.
Cash-flow waterfall
monthlySold comps — $/sqft
last 12 mo · ≤1 miLoading sold comps…