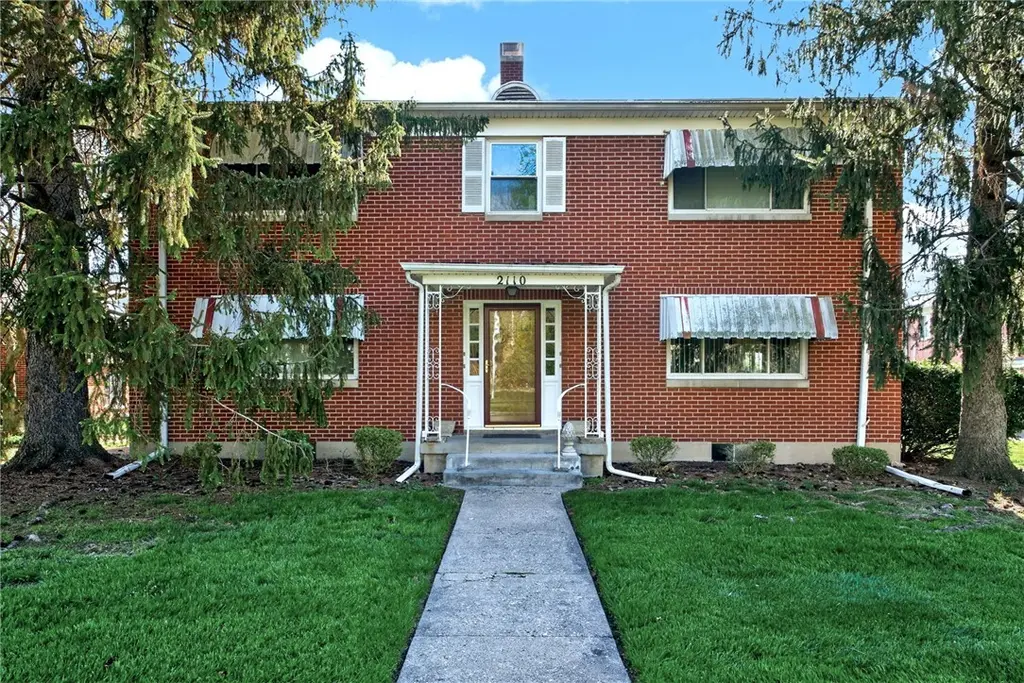
2110 Far Hls
Oakwood, OH 45419
$500,000B
8 bd · 1.0 ba ·
6,678 sqft ·
Built 1950
· MultiFamily
· Pending
· 4 DOM
Cashflow @ list (25.0% down · 7.5%)
Estimated rent
$7,733/mo
Mortgage (P&I)
−$2,622
Tax + insurance
−$1,282
HOA
−$0
Vac / Maint / Mgmt
−$1,624
Net cashflow
$2,205/mo
Annual
$26,461/yr
Cap rate
11.59%
Cash-on-cash
18.90%
DSCR
1.84
1% rule
1.55%
Cash to close
$140,000
Investor read
- This is a 8-bed/1.0-bath multifamily listed at $500k.
- At list price, monthly cash flow is $2k ($26k/yr) — positive.
- The deal already cash-flows at list — no discount required.
- Meets the 1% rule at list price ($8k rent vs $500k).
- Only 4 days on market — expect competitive offers; lowballing is unlikely to land.
- Local home prices are declining (-3.0%/yr); year-one equity from $3k of loan paydown is wiped out by about $15k of value loss. Plan a longer hold.
- Location reads: area grade B — affects rentability + tenant quality, not the cash-flow math above.
- Oakwood City (suburban): math 88% / reading 88% proficiency, ranked #7 of 656 in OH (top 1%) — strong family-tenant draw, lease renewals of 3-5y typical; only 7% free/reduced lunch — higher-income household profile.
- Zoned schools: Smith Elementary School (math 87% / reading 84%, grade A+, #60 of 1,584 statewide, top 4%, 520 students, 6% FRL); Oakwood Junior High School (math 89% / reading 88%, grade A+, #6 of 654 statewide, top 1%, 303 students, 0% FRL); Oakwood High School (math 82% / reading 92%, grade A, #4 of 781 statewide, top 1%, 683 students, 0% FRL) — zoned schools at 2% FRL track the district average.
- Watch-outs: property tax is 2.6% of price; built in 1950 — expect roof / HVAC / electrical / plumbing capex.
- Market conditions: Rents flat; 91 active listings in the ZIP; solid renter incomes; 907 units permitted in Montgomery County in 2024 (416 in 5+ unit buildings).
- Montgomery County population projected at -10% by 2050 — secular population decline; favor cash flow + early exit over multi-decade hold.
- Current owner paid $240k; list at $500k implies a 109% gain — meaningful room to come down on a strong offer.
- At projected returns (-3.0% appreciation + 0.6% rent growth), your $140k cash investment doubles in ~8 years — after that, you're playing with house money.
- Cap rate 11.6% vs local median 2.0% in Oakwood — top-decile yield for the area; either an underpriced asset or a hidden risk that comps aren't pricing in. Stress-test before assuming the spread holds.
- At $7,733/mo this rent would consume 101% of the median local household income ($92k/yr) (locally 359% of renters already pay >50% of income on rent) — very limited rent-growth headroom before tenants either downsize or default.
Questions for listing agent
- Built in 1950 — when were the roof, HVAC, electrical panel, plumbing, and water heater last replaced?
- Property tax is high relative to price — has the assessment been appealed recently, and will the sale trigger a re-assessment?
- Is there a deadline driving the sale (1031 exchange, divorce, estate, relocation)? That informs how much negotiation room exists.
- What's the average days-on-market for RENTAL listings here right now (not sales)? A rising rental-DOM trend means longer vacancies and softer asking-rent achievability than the comps imply.
- What's the recent tenant-quality profile in this submarket — average credit score on applications, eviction rate, late-payment / NSF rate, and stable-employment percentage? A property-management company in the area should have these aggregated.
- How much new apartment / multifamily construction is in the pipeline within 1–3 miles? Heavy new supply (>2% of stock underway) typically softens rents 12–24 months out; light construction supports rent growth.
CashFlowRE · CFR-BNCN3YAVJX9TGT
· Data 4 weeks ago
cashflowre.app · 2026-05-29