 Multi-family
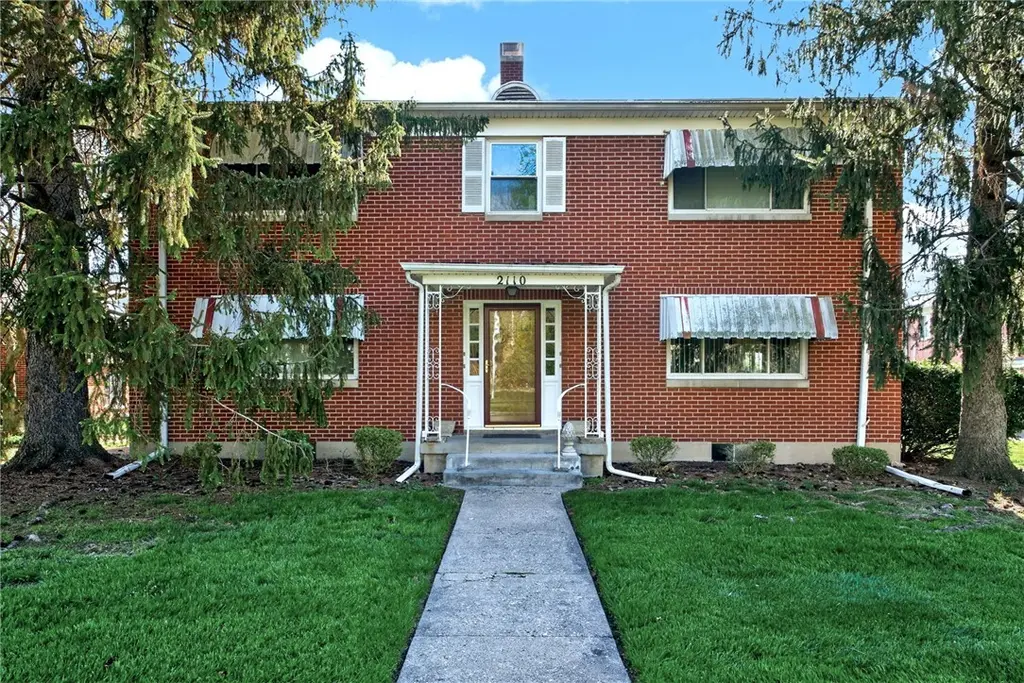
2110 Far Hls · Oakwood, OH
Flood risk No data
- FEMA flood zone
- —
- Chance of flooding over 30 yrs
- —
- Est. flood insurance / yr
- —
Fire risk No data
- Est. fire insurance / yr
- —
Heat risk No data
- Hot days now (above threshold)
- —
- Hot days in 30 yrs
- —
Wind risk No data
- Chance of severe wind over 30 yrs
- —
Air-quality risk No data
- Unhealthy air days now
- —
- Unhealthy air days in 30 yrs
- —
Risk factors via First Street. Map © Google.
Why this score? — see what drove the B grade
The composite is a weighted blend of 9 inputs, each scored 0–100. Each bar is that input's sub-score; the figure is the points it added to the 100-point composite (weight × sub-score).
- Cash flow +30.0/30.0
- 1% rule +10.0/10.0
- DSCR +10.0/10.0
- ARV discount +9.3/15.0
- Schools +7.8/10.0
- Rent growth +2.6/5.0
- Livability +2.5/5.0
- Condition / age +2.5/5.0
- Appreciation +0.0/10.0
$500,000
🖨 Deal sheet (PDF) 📄 Offer letter ✓ Due diligence
Multi-family units
County records classify this as Multi-Family (5+ Unit). Listing-text estimate: 1 unit. estimate disagrees with records
5+ unit building — per-unit beds/baths from public records are typically unavailable; the breakdown below (if shown) is an estimate from the listing text.
Listing remarks
Fantastic opportunity to own a fully occupied investment property in the highly desirable City of Oakwood! This well-maintained four-unit building includes a four-car detached garage and offers immediate, consistent cash flow for the new owner. Each unit is approximately 1,113 square feet and features an identical layout with similar finishes and updates throughout, providing uniformity and ease of management. Tenants enjoy access to a full basement, with individual secure storage spaces and washer/dryer hookups. All units are separately metered for gas and electric, while the owner currently pays water, sewer, and trash through city services. Please do not contact tenants or walk the prope
Key facts
- Four unit building
- Full basement
- Washer dryer hookups
Tags
Neighborhood map
What this means for you Summary
Snapshot
- This is a 8-bed/1.0-bath multifamily listed at $500k.
Deal economics
- At list price, monthly cash flow is $2k ($26k/yr) — positive.
- The deal already cash-flows at list — no discount required.
- Meets the 1% rule at list price ($8k rent vs $500k).
- Cap rate 11.6% vs local median 2.0% in Oakwood — top-decile yield for the area; either an underpriced asset or a hidden risk that comps aren't pricing in. Stress-test before assuming the spread holds.
Location & tenants
- Location reads: area grade B — affects rentability + tenant quality, not the cash-flow math above.
- Oakwood City (suburban): math 88% / reading 88% proficiency, ranked #7 of 656 in OH (top 1%) — strong family-tenant draw, lease renewals of 3-5y typical; only 7% free/reduced lunch — higher-income household profile.
- Zoned schools: Smith Elementary School (math 87% / reading 84%, grade A+, #60 of 1,584 statewide, top 4%, 520 students, 6% FRL); Oakwood Junior High School (math 89% / reading 88%, grade A+, #6 of 654 statewide, top 1%, 303 students, 0% FRL); Oakwood High School (math 82% / reading 92%, grade A, #4 of 781 statewide, top 1%, 683 students, 0% FRL) — zoned schools at 2% FRL track the district average.
- Market conditions: Rents flat; 91 active listings in the ZIP; solid renter incomes; 907 units permitted in Montgomery County in 2024 (416 in 5+ unit buildings).
- At $7,733/mo this rent would consume 101% of the median local household income ($92k/yr) (locally 359% of renters already pay >50% of income on rent) — very limited rent-growth headroom before tenants either downsize or default.
Forward outlook
- Local home prices are declining (-3.0%/yr); year-one equity from $3k of loan paydown is wiped out by about $15k of value loss. Plan a longer hold.
- Montgomery County population projected at -10% by 2050 — secular population decline; favor cash flow + early exit over multi-decade hold.
- At projected returns (-3.0% appreciation + 0.6% rent growth), your $140k cash investment doubles in ~8 years — after that, you're playing with house money.
Negotiation context
- Only 4 days on market — expect competitive offers; lowballing is unlikely to land.
- Current owner paid $240k; list at $500k implies a 109% gain — meaningful room to come down on a strong offer.
Risks & watch-outs
- Watch-outs: property tax is 2.6% of price; built in 1950 — expect roof / HVAC / electrical / plumbing capex.
Questions for the listing agent
- Built in 1950 — when were the roof, HVAC, electrical panel, plumbing, and water heater last replaced?
- Property tax is high relative to price — has the assessment been appealed recently, and will the sale trigger a re-assessment?
- Is there a deadline driving the sale (1031 exchange, divorce, estate, relocation)? That informs how much negotiation room exists.
- What's the average days-on-market for RENTAL listings here right now (not sales)? A rising rental-DOM trend means longer vacancies and softer asking-rent achievability than the comps imply.
- What's the recent tenant-quality profile in this submarket — average credit score on applications, eviction rate, late-payment / NSF rate, and stable-employment percentage? A property-management company in the area should have these aggregated.
- How much new apartment / multifamily construction is in the pipeline within 1–3 miles? Heavy new supply (>2% of stock underway) typically softens rents 12–24 months out; light construction supports rent growth.
Investment metrics
- 1% rule
- 1.55% ✓
- Cap rate
- 11.59%
- Cash-on-cash
- 18.90%
- DSCR
- 1.84
- GRM
- 5.4
CMA / ARV
- ARV (on-the-fly)
- $520,884
- Comps found
- 1
Show comp detail 1 sale within ~0.75 mi
| Address | Dist | Beds/Ba | Sqft | Sold | Price | $/sf | Match |
|---|---|---|---|---|---|---|---|
| 440 Lonsdale Ave | 0.60mi | 8/4.0 | 7,056 (+6%) | 12mo | $550,000 | $78 | 41 |
Match score weights: distance 35% · size 25% · config 20% · recency 20%. Top-matched comps best support the ARV.
Projected returns pro-forma
-3.0% appreciation · 0.57% rent growth · sell at horizon
- IRR
- 7.8%
- Equity multiple
- 1.30×
- Total profit
- $41,352
- Equity at exit
- $74,552
- IRR
- 14.7%
- Equity multiple
- 2.04×
- Total profit
- $146,295
- Equity at exit
- $43,231
Cash invested: $140,000 (down + closing). Projections, not guarantees.
Landlord ↔ Tenant lean methodology
- Overall (STATE)
- 73 Landlord-Friendly
- State Ohio
- 73 Landlord-Friendly · R+6
- County
- — inherits STATE
- City
- — inherits STATE
ZIP-level market 45419
- Rents YoY
- 0.6%
- Active inventory
- 91
- Price-to-rent
- 21.6×
Monthly cashflow live
- Estimated rent
- $7,733 high interval (Pro) →
- Mortgage (P&I)
- −$2,622
- Tax from tax record
- −$1,074 /mo · $12,884/yr
- Insurance
- −$208
- HOA
- −$0
- Vacancy / Maint / Mgmt
- −$1,624
- Net cashflow
- $2,205
Break-even live
Sensitivity live
| Price | -10% $2,488 | -5% $2,347 | +0% $2,205 | +5% $2,064 | +10% $1,922 |
|---|---|---|---|---|---|
| Rent | -10% $1,594 | -5% $1,900 | +0% $2,205 | +5% $2,511 | +10% $2,816 |
| Rate | -1.0pp $2,457 | -0.5pp $2,332 | base $2,205 | +0.5pp $2,075 | +1.0pp $1,944 |
4-unit breakdown (identical units grouped — click to expand)
| Units | Beds | Baths | Est. rent |
|---|---|---|---|
| 4× units | 2 | 1 | $7,732 |
| #1 | 2 | 1 | $1,933 |
| #2 | 2 | 1 | $1,933 |
| #3 | 2 | 1 | $1,933 |
| #4 | 2 | 1 | $1,933 |
| Total (4 units) | $7,733 | ||
UW: 25.0% down · 7.5% · 30yr · 1.5% tax · 5.0% vac · 8.0% maint · 8.0% mgmt
Financing live
Cash to close
- Down payment
- $125,000
- Closing costs
- $15,000
- Reserves months
- —
- Total cash needed
- —
Loan-product check · same deal, 3 products live
Conventional
25% down · 7.5% · 30yr
- Down + closing
- —
- Monthly P&I
- —
- Monthly cashflow
- —
- DSCR
- —
- Eligible?
- —
Personal DTI + credit; lowest rate.
DSCR
20% down · 8.5% · 30yr
- Down + closing
- —
- Monthly P&I
- —
- Monthly cashflow
- —
- DSCR
- —
- Eligible?
- —
No personal income docs; deal must DSCR.
Hard money
10% down · 12.0% · 12mo
- Down + closing
- —
- Monthly P&I
- —
- Monthly cashflow
- —
- DSCR
- —
- Eligible?
- —
Short-term bridge; refi at stabilization.
Listing history 4 events
-
2026-04-18status Pending
-
2026-04-13$500,000 Active
-
2006-11-28soldstatus $239,500
-
1996-11-05soldstatus $197,000
ⓘ Source: listings_history table (triggers on properties + properties_extension) + one-shot
backfill from property_details.listing_events for pre-trigger history.
Tax reassessment forecast OH · Partial reset (capped growth)
- Current annual tax
- $12,884 · $1,074/mo
- Projected year-2 tax
- $12,884 · $1,074/mo
- Expected delta
- $0/yr ($0/mo · 0.0%)
ⓘ Screening estimate from a state-policy table — verify with the county assessor before closing.
Nearby sold comps map
Loading sold comps map…
Walkable amenities ~0.75 mi
Loading nearby amenities…
Taxation est. · year 1
- Rental income
- $92,796
- − Mortgage interest
- −$28,008
- − Property taxes
- −$12,884
- − Insurance
- −$2,500
- − Repairs & maintenance
- −$7,424
- − Management
- −$7,424
- − Depreciation
- −$14,545
- Taxable income
- $20,012
- Est. tax owed @ 24.0%
- −$4,803
- After-tax cash flow
- $21,658/yr
For passive investors: Depreciation is non-cash, so a rental often shows a tax loss while cash-flowing — sheltering income. Rental losses are passive: they offset passive income freely, and up to $25,000/yr can offset ordinary (W-2) income if you actively participate and your MAGI is under $100k (phasing out to $0 by $150k); unused losses carry forward. On sale, claimed depreciation is recaptured at up to 25%, and gains may owe capital-gains tax (a 1031 exchange can defer both). Figures are a year-1 estimate at your 24.0% rate — not tax advice; consult a CPA.
Schools (NCES district)
- District
- Oakwood City
- NCES district ID
- 3904458
- Math proficiency
- 88% ▼ -2.00%
- Reading proficiency
- 88% ▼ -2.00%
- Median HH income
- $93,178
- Composite
- 78.43/100
- National rank
- #78
- State rank
- #7 of 656 in OH
Livability — Oakwood
No livability data for this city. (Only ~50 U.S. cities are tracked.)
Census & demographics
- Census place
- Oakwood, OH
- County
- Montgomery County · 459,541 people
- City population
- 32,301
- Metro
- Dayton-Kettering, OH
- Population (ZIP)
- 17,008
- Household income
- $92,264
- Rent vs Own
- Severe rent burden
- 359.0
Population outlook (Montgomery County) Hauer SSP2
- Today (2025)
- 523,241 people
- By 2030
- 514,948 · -1.6%
- By 2040
- 493,378 · -5.7%
- By 2050
- 469,639 · -10.2%
- By 2075
- 418,360 · -20.0%
- By 2100
- 353,315 · -32.5%
Race, ethnicity, and origin ACS 2023
- Neighborhood character
- Predominantly White (87%)
- Race & ethnicity
- White 87% Two or more races 8% Hispanic / Latino 2% Asian 2% Black 2%
- Common ancestry
- Slovak 4% Romanian 4% Lithuanian 3%
- Foreign-born
- 4% · China, Canada
- Languages at home
- 95% English-only · Tagalog/Filipino 1% Other Indo-European 1% Chinese 1%
Political lean MEDSL · Montgomery
- 2024 margin
- Toss-up / Even · D 49.8% · R 49.3%
- 2008→2024 swing
- -5.8pp toward R · 2008: 6.2pp · 2024: 0.5pp
- All cycles
- 2024: D+0.5 2020: D+2.2 2016: R+1.2 2012: D+3.1 2008: D+6.2
Not yet ingested
- Civics
- —
Market trends
- HPI YoY
- ▼ -259.40%
- Current HPI
- 246.866
- Rent YoY
- ▲ 0.57%
- Metro
- Dayton-Kettering, OH
- State GDP YoY
- ▲ 1.98%
- F500 in state
- 48
Industry mix (Fortune 500 HQ in OH)
| Industry | F500 HQs | Revenue |
|---|---|---|
| Insurance | 3 | $145B |
|
||
| Industrial Machinery | 3 | $49B |
|
||
| Financial Services | 3 | $24B |
|
||
| Consumer Goods | 2 | $93B |
|
||
| Aerospace / Defense | 2 | $47B |
|
||
| Utilities | 2 | $33B |
|
||
Price history
+153.8% since first listed4 events — show timeline
- 2026-04-18 Pending — Dayton MLS
- 2026-04-13 Listed $500,000 Dayton MLS
- 2006-11-28 Sold (Public Records) $239,500 Public Records
- 1996-11-05 Sold (Public Records) $197,000 Public Records
Property tax history
+3.4%/yrLatest (2025): $12,884 · +3.7% YoY. Source: county tax records.
Cash-flow waterfall
monthlySold comps — $/sqft
last 12 mo · ≤1 miLoading sold comps…