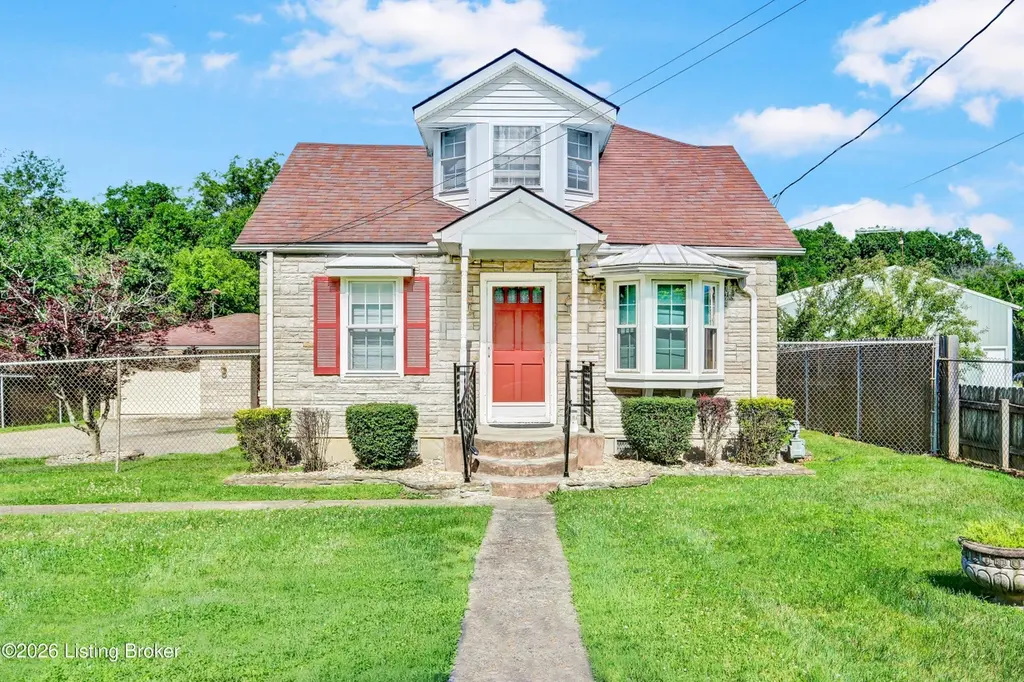
404 Gilliland Rd
Louisville/Jefferson County metro government (balance), KY 40245
$225,000C
2 bd · 2.0 ba ·
1,499 sqft ·
Built 1947
· SingleFamily
· Active
· 3 DOM
Cashflow @ list (25.0% down · 7.5%)
Estimated rent
$2,119/mo
Mortgage (P&I)
−$1,180
Tax + insurance
−$190
HOA
−$0
Vac / Maint / Mgmt
−$445
Net cashflow
$305/mo
Annual
$3,658/yr
Cap rate
7.92%
Cash-on-cash
5.81%
DSCR
1.26
1% rule
0.94%
Cash to close
$63,000
Investor read
- This is a 2-bed/2.0-bath single-family listed at $225k.
- At list price, monthly cash flow is $305 ($4k/yr) — positive.
- The deal already cash-flows at list — no discount required.
- To meet the 1% rule (rent ≥ 1% of price), the offer needs to be $212k (5.8% below list).
- Only 3 days on market — expect competitive offers; lowballing is unlikely to land.
- Recommended offer: $212k (5.8% below list) — sets the bar for 1% rule.
- Local home prices are declining (-3.0%/yr); year-one equity from $2k of loan paydown is wiped out by about $7k of value loss. Plan a longer hold.
- Location reads: area grade C — affects rentability + tenant quality, not the cash-flow math above.
- Jefferson County (urban): math 19% / reading 35% proficiency, ranked #121 of 165 in KY (top 73%) — low school quality limits family demand, transient renter base, plan for 1-2y turnover.
- Zoned schools: Tully Elementary (math 35% / reading 49%, grade F, #178 of 676 statewide, top 29%, 788 students, 38% FRL); Crosby Middle (math 32% / reading 49%, grade F, #57 of 217 statewide, top 26%, 1,016 students, 46% FRL); Eastern High (math 44% / reading 45%, grade F, #21 of 254 statewide, top 10%, 2,036 students, 37% FRL) — zoned schools average 40% FRL vs 56% district-wide (16 pts lower); this property's tenant base skews higher-income than the district average.
- Zoned-school proficiency averages 42% at this address vs 27% district-wide (+15 pts) — the actual schools serving this property are materially stronger than the Jefferson County average implies; a family-tenant draw the district grade alone would hide.
- Watch-outs: built in 1947 — expect roof / HVAC / electrical / plumbing capex.
- Market conditions: Rents rising (+1.2%/yr); 349 active listings in the ZIP; 2 comparable units currently listed for rent nearby; high-income renter base; 2,836 units permitted in Jefferson County in 2024 (1,558 in 5+ unit buildings).
- Jefferson County population projected at +13% by 2050 — modest demand growth; plan on rents tracking national, not racing it.
- Cap rate 7.9% vs local median 4.0% in Louisville/Jefferson County metro government (balance) — top-decile yield for the area; either an underpriced asset or a hidden risk that comps aren't pricing in. Stress-test before assuming the spread holds.
Questions for listing agent
- Built in 1947 — when were the roof, HVAC, electrical panel, plumbing, and water heater last replaced?
- Is there a deadline driving the sale (1031 exchange, divorce, estate, relocation)? That informs how much negotiation room exists.
- What's the average days-on-market for RENTAL listings here right now (not sales)? A rising rental-DOM trend means longer vacancies and softer asking-rent achievability than the comps imply.
- What's the recent tenant-quality profile in this submarket — average credit score on applications, eviction rate, late-payment / NSF rate, and stable-employment percentage? A property-management company in the area should have these aggregated.
- How much new for-sale + rental construction is in the pipeline within 1–3 miles? Heavy new supply typically softens prices + rents 12–24 months out; constrained supply supports both.
CashFlowRE · CFR-BNJEMYDTBTH1VD
· Data 22 h ago
cashflowre.app · 2026-05-29