404 Gilliland Rd · Louisville/Jefferson County metro government (balance), KY
Flood risk 1/10 · Minimal
- FEMA flood zone
- X (unshaded)
- Chance of flooding over 30 yrs
- 0.0%
- Est. flood insurance / yr
- $507 – $1,088
Fire risk 1/10 · Minimal
- Est. fire insurance / yr
- $839 – $1,559
Heat risk 4/10 · Minor
- Hot days now (above 104°F)
- 7 days/yr
- Hot days in 30 yrs
- 18 days/yr
Wind risk 2/10 · Minimal
- Chance of severe wind over 30 yrs
- 2.0%
Air-quality risk 2/10 · Minimal
- Unhealthy air days now
- 1 days/yr
- Unhealthy air days in 30 yrs
- 2 days/yr
Risk factors via First Street. Map © Google.
Why this score? — see what drove the C grade
The composite is a weighted blend of 9 inputs, each scored 0–100. Each bar is that input's sub-score; the figure is the points it added to the 100-point composite (weight × sub-score).
- Cash flow +20.7/30.0
- ARV discount +15.0/15.0
- DSCR +6.6/10.0
- 1% rule +4.4/10.0
- Rent growth +2.8/5.0
- Livability +2.5/5.0
- Condition / age +2.5/5.0
- Schools +2.3/10.0
- Appreciation +0.0/10.0
$225,000
🖨 Deal sheet (PDF) 📄 Offer letter ✓ Due diligence
Listing remarks
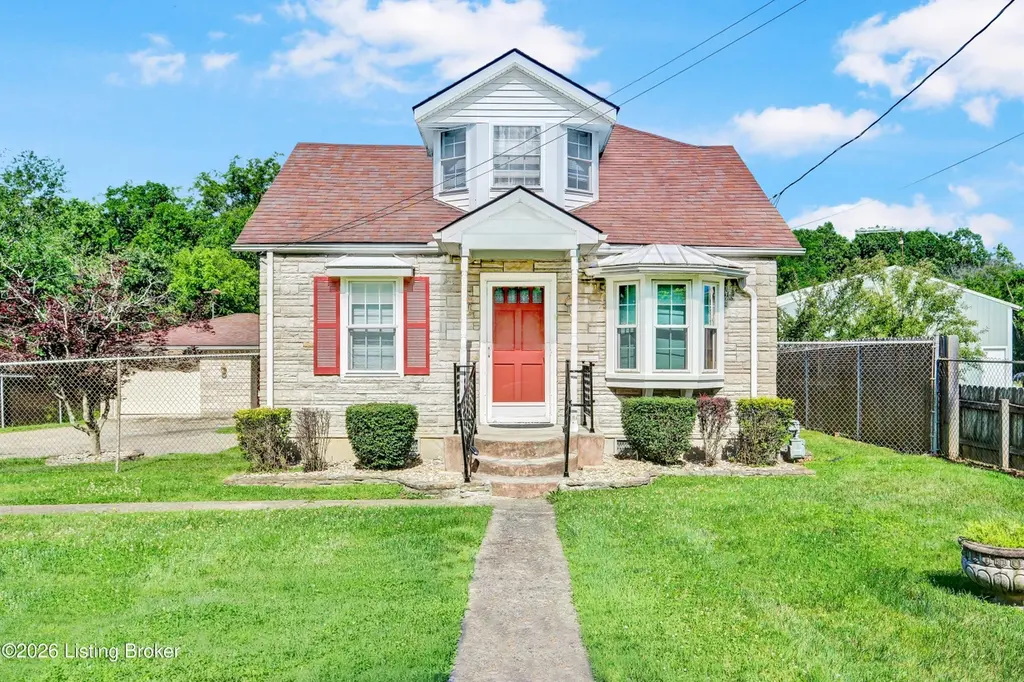
This 2 bedroom, 2 full bath home with a large driveway and 1 car garage is where country charm meets everyday convenience in one of Louisville's most sought-after areas. Nestled on nearly 1.5 scenic acres, this property offers a rare opportunity to enjoy privacy, open space, and a peaceful setting while remaining just minutes from shopping, dining, parks, and more! Whether you're looking for your first home, or the perfect canvas for buyers with vision, you'll appreciate the possibilities this unique property offers. The first floor features a kitchen with breakfast nook, large dining area (that was originally a 3rd bedroom), office & flex space, living room, bedroom, full bath and l
Key facts
- Large driveway
- Firepit
- Expansive yard
Tags
Property features AI
Finance
- HOA & community: No association fee
Exterior
- Parking: Detached garage (1 car); Driveway
- Utilities: Electricity connected
- Home design: Single-family residence, Cape Cod style; Two stories; Entry from front
- Construction: Built in 1947; Wood frame with stone veneer; Shingle roof; Crawl space foundation
- Exterior features: Partial chain-link fencing; Lot features: see remarks
Interior
- Kitchen: Kitchen on the first floor; Dining room on the first floor
- Bedrooms: Two bedrooms total; One bedroom on the first floor; Primary bedroom on the second floor
- Bathrooms: Two full bathrooms; Full bathroom on the first floor; Primary bathroom on the second floor
- Heating & cooling: Natural gas heating; Central air and wall/window unit(s) for cooling
- Interior features: Seven total rooms; Six closets; No basement; Primary bedroom and primary bathroom on the second floor
- Laundry & utility: First-floor laundry
Neighborhood map
What this means for you Summary
Snapshot
- This is a 2-bed/2.0-bath single-family listed at $225k.
Deal economics
- At list price, monthly cash flow is $305 ($4k/yr) — positive.
- The deal already cash-flows at list — no discount required.
- To meet the 1% rule (rent ≥ 1% of price), the offer needs to be $212k (5.8% below list).
- Recommended offer: $212k (5.8% below list) — sets the bar for 1% rule.
- Cap rate 7.9% vs local median 4.0% in Louisville/Jefferson County metro government (balance) — top-decile yield for the area; either an underpriced asset or a hidden risk that comps aren't pricing in. Stress-test before assuming the spread holds.
Location & tenants
- Location reads: area grade C — affects rentability + tenant quality, not the cash-flow math above.
- Jefferson County (urban): math 19% / reading 35% proficiency, ranked #121 of 165 in KY (top 73%) — low school quality limits family demand, transient renter base, plan for 1-2y turnover.
- Zoned schools: Tully Elementary (math 35% / reading 49%, grade F, #178 of 676 statewide, top 29%, 788 students, 38% FRL); Crosby Middle (math 32% / reading 49%, grade F, #57 of 217 statewide, top 26%, 1,016 students, 46% FRL); Eastern High (math 44% / reading 45%, grade F, #21 of 254 statewide, top 10%, 2,036 students, 37% FRL) — zoned schools average 40% FRL vs 56% district-wide (16 pts lower); this property's tenant base skews higher-income than the district average.
- Zoned-school proficiency averages 42% at this address vs 27% district-wide (+15 pts) — the actual schools serving this property are materially stronger than the Jefferson County average implies; a family-tenant draw the district grade alone would hide.
- Market conditions: Rents rising (+1.2%/yr); 349 active listings in the ZIP; 2 comparable units currently listed for rent nearby; high-income renter base; 2,836 units permitted in Jefferson County in 2024 (1,558 in 5+ unit buildings).
Forward outlook
- Local home prices are declining (-3.0%/yr); year-one equity from $2k of loan paydown is wiped out by about $7k of value loss. Plan a longer hold.
- Jefferson County population projected at +13% by 2050 — modest demand growth; plan on rents tracking national, not racing it.
Negotiation context
- Only 3 days on market — expect competitive offers; lowballing is unlikely to land.
Risks & watch-outs
- Watch-outs: built in 1947 — expect roof / HVAC / electrical / plumbing capex.
Questions for the listing agent
- Built in 1947 — when were the roof, HVAC, electrical panel, plumbing, and water heater last replaced?
- Is there a deadline driving the sale (1031 exchange, divorce, estate, relocation)? That informs how much negotiation room exists.
- What's the average days-on-market for RENTAL listings here right now (not sales)? A rising rental-DOM trend means longer vacancies and softer asking-rent achievability than the comps imply.
- What's the recent tenant-quality profile in this submarket — average credit score on applications, eviction rate, late-payment / NSF rate, and stable-employment percentage? A property-management company in the area should have these aggregated.
- How much new for-sale + rental construction is in the pipeline within 1–3 miles? Heavy new supply typically softens prices + rents 12–24 months out; constrained supply supports both.
Investment metrics
- 1% rule
- 0.94% ✗
- Cap rate
- 7.92%
- Cash-on-cash
- 5.81%
- DSCR
- 1.26
- GRM
- 8.8
CMA / ARV
- ARV (on-the-fly)
- $356,762
- Comps found
- 5
Show comp detail 5 sales within ~0.75 mi
| Address | Dist | Beds/Ba | Sqft | Sold | Price | $/sf | Match |
|---|---|---|---|---|---|---|---|
| 107 Spring Dr | 0.36mi | 2/2.0 | 1,543 (+3%) | 19mo | $241,000 | $156 | 62 |
| 810 Gilliland Rd | 0.40mi | 3/2.0 (+1) | 1,350 (-10%) | 7mo | $375,000 | $278 | 54 |
| 919 Gilliland Rd | 0.63mi | 2/1.5 | 1,650 (+10%) | 3mo | $300,000 | $182 | 49 |
| 211 Brookfield Hills Ct | 0.59mi | 3/2.0 (+1) | 1,603 (+7%) | 18mo | $400,000 | $250 | 41 |
| 16506 Rockcrest View Ln | 0.67mi | 3/2.5 (+1) | 1,683 (+12%) | 10mo | $400,000 | $238 | 33 |
Match score weights: distance 35% · size 25% · config 20% · recency 20%. Top-matched comps best support the ARV.
Projected returns pro-forma
-3.0% appreciation · 1.24% rent growth · sell at horizon
- IRR
- -9.2%
- Equity multiple
- 0.67×
- Total profit
- $-20,816
- Equity at exit
- $33,548
- IRR
- -2.0%
- Equity multiple
- 0.87×
- Total profit
- $-8,070
- Equity at exit
- $19,454
Cash invested: $63,000 (down + closing). Projections, not guarantees.
Landlord ↔ Tenant lean methodology
- Overall (STATE)
- 83 Strongly Landlord-Friendly
- State Kentucky
- 83 Strongly Landlord-Friendly · R+16
- County
- — inherits STATE
- City
- — inherits STATE
ZIP-level market 40245
- Home prices YoY
- -24.9%
- Rents YoY
- 1.2%
- Active inventory
- 349
- Price-to-rent
- 8.8×
Monthly cashflow live
- Estimated rent
- $2,119 medium interval (Pro) →
- Mortgage (P&I)
- −$1,180
- Tax from tax record
- −$96 /mo · $1,150/yr
- Insurance
- −$94
- HOA
- −$0
- Vacancy / Maint / Mgmt
- −$445
- Net cashflow
- $305
Break-even live
Sensitivity live
| Price | -10% $432 | -5% $369 | +0% $305 | +5% $241 | +10% $177 |
|---|---|---|---|---|---|
| Rent | -10% $137 | -5% $221 | +0% $305 | +5% $389 | +10% $472 |
| Rate | -1.0pp $418 | -0.5pp $362 | base $305 | +0.5pp $247 | +1.0pp $187 |
UW: 25.0% down · 7.5% · 30yr · 1.5% tax · 5.0% vac · 8.0% maint · 8.0% mgmt
Financing live
Cash to close
- Down payment
- $56,250
- Closing costs
- $6,750
- Reserves months
- —
- Total cash needed
- —
Loan-product check · same deal, 3 products live
Conventional
25% down · 7.5% · 30yr
- Down + closing
- —
- Monthly P&I
- —
- Monthly cashflow
- —
- DSCR
- —
- Eligible?
- —
Personal DTI + credit; lowest rate.
DSCR
20% down · 8.5% · 30yr
- Down + closing
- —
- Monthly P&I
- —
- Monthly cashflow
- —
- DSCR
- —
- Eligible?
- —
No personal income docs; deal must DSCR.
Hard money
10% down · 12.0% · 12mo
- Down + closing
- —
- Monthly P&I
- —
- Monthly cashflow
- —
- DSCR
- —
- Eligible?
- —
Short-term bridge; refi at stabilization.
Rent comps 2 comps
| Address | Beds | Baths | Sqft | Rent | $/sqft | DOM | Units | Dist |
|---|---|---|---|---|---|---|---|---|
| 17810 Birch Bend Cir Fisherville, KY | 3.0 | 2.0 | 1505 | $2,520 | $1.67 | 3d | 1 | 1.14mi |
| 15308 Royal Troon Ave Bldg 9 Louisville, KY | 3.0 | 2.0 | 1823 | $2,850 | $1.56 | 13d | 1 | 1.45mi |
Listing history 3 events
-
2026-06-21days on market $225,000 Active 3 DOM
-
2026-06-18remarks 695-char remark
-
2026-06-18$225,000 Active 1 DOM
ⓘ Source: listings_history table (triggers on properties + properties_extension) + one-shot
backfill from property_details.listing_events for pre-trigger history.
Tax reassessment forecast KY · Resets to sale price
- Current annual tax
- $1,150 · $96/mo
- Projected year-2 tax
- $1,935 · $161/mo
- Expected delta
- +$785/yr (+$65/mo · 68.2%)
ⓘ Screening estimate from a state-policy table — verify with the county assessor before closing.
Climate risk First Street
- Flood 1/10 Low FEMA zone X (unshaded) · 0% chance over 30 yrs
- Wildfire 1/10 Low
- Heat 4/10 Moderate 7 d/yr ≥104°F today · 18 d/yr by 30 yrs out
- Wind 2/10 Low 2% chance of damaging wind over 30 yrs
- Air quality 2/10 Low 1 unhealthy d/yr today · 2 by 30 yrs out
Nearby sold comps map
Loading sold comps map…
Walkable amenities ~0.75 mi
Loading nearby amenities…
Taxation est. · year 1
- Rental income
- $25,433
- − Mortgage interest
- −$12,603
- − Property taxes
- −$1,150
- − Insurance
- −$1,125
- − Repairs & maintenance
- −$2,035
- − Management
- −$2,035
- − Depreciation
- −$6,545
- Taxable loss
- −$60
- Est. tax savings @ 24.0%
- +$14
- After-tax cash flow
- $3,672/yr
For passive investors: Depreciation is non-cash, so a rental often shows a tax loss while cash-flowing — sheltering income. Rental losses are passive: they offset passive income freely, and up to $25,000/yr can offset ordinary (W-2) income if you actively participate and your MAGI is under $100k (phasing out to $0 by $150k); unused losses carry forward. On sale, claimed depreciation is recaptured at up to 25%, and gains may owe capital-gains tax (a 1031 exchange can defer both). Figures are a year-1 estimate at your 24.0% rate — not tax advice; consult a CPA.
Schools (NCES district)
- District
- Jefferson County
- NCES district ID
- 2102990
- Math proficiency
- 19% ▼ -17.00%
- Reading proficiency
- 35% ▼ -11.00%
- Median HH income
- $47,885
- Composite
- 23.45/100
- National rank
- #7884
- State rank
- #121 of 165 in KY
Livability — Louisville/Jefferson County metro government (balance)
No livability data for this city. (Only ~50 U.S. cities are tracked.)
Census & demographics
- Census place
- Louisville/Jefferson County metro government (balance), KY
- County
- Jefferson County · 790,184 people
- City population
- 419,741
- Metro
- Louisville/Jefferson County, KY-IN
- Population (ZIP)
- 39,835
- Household income
- $122,948
- Rent vs Own
- Severe rent burden
- 826.0
Population outlook (Jefferson County) Hauer SSP2
- Today (2025)
- 823,112 people
- By 2030
- 849,343 · +3.2%
- By 2040
- 895,696 · +8.8%
- By 2050
- 933,630 · +13.4%
- By 2075
- 1,028,262 · +24.9%
- By 2100
- 1,072,675 · +30.3%
Race, ethnicity, and origin ACS 2023
- Neighborhood character
- Predominantly White (74%)
- Race & ethnicity
- White 74% Black 8% Asian 8% Two or more races 7% Hispanic / Latino 6%
- Hispanic origin (detail)
- Mexican 2% Cuban 2%
- Common ancestry
- Slovak 2% Romanian 2% Lithuanian 2%
- Foreign-born
- 11% · Canada, China, Jamaica
- Languages at home
- 87% English-only · Spanish 4% Other Indo-European 4% Other Asian/Pacific 2%
Political lean MEDSL · Jefferson
- 2024 margin
- D (+16.6) · D 57.4% · R 40.9% · Other 1.7%
- 2008→2024 swing
- +4.5pp toward D · 2008: 12.0pp · 2024: 16.6pp
- All cycles
- 2024: D+16.6 2020: D+20.1 2016: D+13.3 2012: D+11.1 2008: D+12.0
Not yet ingested
- Civics
- —
Market trends
- HPI YoY
- ▼ -72.50%
- Current HPI
- 218.7477
- Rent YoY
- ▲ 1.24%
- Metro
- Louisville/Jefferson County, KY-IN
- State GDP YoY
- ▲ 1.81%
- F500 in state
- 4
Industry mix (Fortune 500 HQ in KY)
| Industry | F500 HQs | Revenue |
|---|---|---|
| Healthcare | 1 | $118B |
|
||
| Food / Beverage | 1 | $7B |
|
||
Price history
1 event — show timeline
- 2026-06-18 Listed $225,000 Metro Search MLS
Property tax history
+2.0%/yrLatest (2025): $1,150 · -4.5% YoY. Source: county tax records.
Cash-flow waterfall
monthlySold comps — $/sqft
last 12 mo · ≤1 miLoading sold comps…