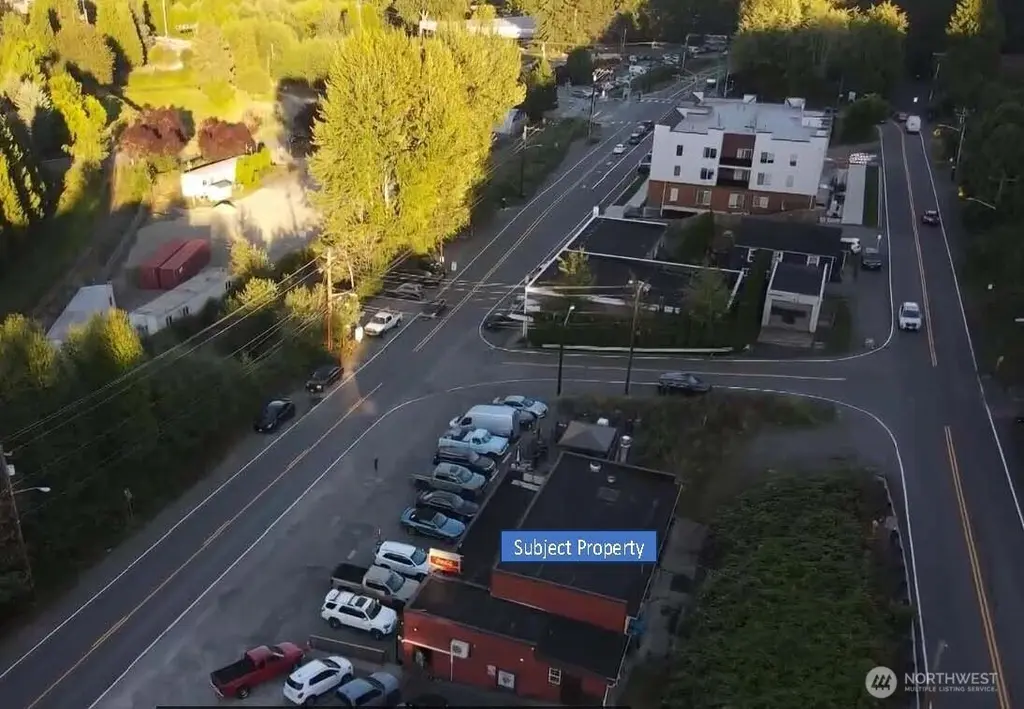
12461 NE Woodinville Dr
Woodinville, WA 98072
$10,500,000B+
None bd · None ba ·
3,553 sqft ·
Built 1949
· MultiFamily
· Active
· 42 DOM
Cashflow @ list (25.0% down · 7.5%)
Estimated rent
$334,394/mo
Mortgage (P&I)
−$55,063
Tax + insurance
−$17,500
HOA
−$0
Vac / Maint / Mgmt
−$70,223
Net cashflow
$191,608/mo
Annual
$2,299,297/yr
Cap rate
28.19%
Cash-on-cash
78.21%
DSCR
4.48
1% rule
3.18%
Cash to close
$2,940,000
Investor read
- This is a multifamily listed at $10.50M. Condition is rated excellent.
- At list price, monthly cash flow is $192k ($2.30M/yr) — positive.
- The deal already cash-flows at list — no discount required.
- Meets the 1% rule at list price ($334k rent vs $10.50M).
- It's been on market 42 days — a 3% lower offer ($10.19M) is reasonable based on typical stale-listing flexibility.
- Recommended offer: $10.19M (3.0% below list) — sets the bar for market timing.
- Local home prices are declining (-3.0%/yr); year-one equity from $73k of loan paydown is wiped out by about $315k of value loss. Plan a longer hold.
- Location reads 86/100 on livability (#18 in WA, #349 nationally) — a professional / high-income tenant draw. Strengths: schools A+, amenities A+, commute A+; Watch: cost of living F.
- Northshore School District (suburban): math 69% / reading 78% proficiency, ranked #9 of 291 in WA (top 3%) — strong family-tenant draw, lease renewals of 3-5y typical; only 12% free/reduced lunch — higher-income household profile.
- Watch-outs: built in 1949 — expect roof / HVAC / electrical / plumbing capex.
- Market conditions: Rents soft (-1.0%/yr); 192 active listings in the ZIP; 1 comparable units currently listed for rent nearby; high-income renter base; 10,555 units permitted in King County in 2024 (7,119 in 5+ unit buildings).
- King County population projected at +44% by 2050 — long-run rental-demand tailwind backs the buy-and-hold thesis.
- At projected returns (-3.0% appreciation + 0.0% rent growth), your $2.94M cash investment doubles in ~2 years — after that, you're playing with house money.
- Cap rate 28.2% vs local median 1.2% in Woodinville — top-decile yield for the area; either an underpriced asset or a hidden risk that comps aren't pricing in. Stress-test before assuming the spread holds.
- At $334,394/mo this rent would consume 2282% of the median local household income ($176k/yr) (locally 588% of renters already pay >50% of income on rent) — very limited rent-growth headroom before tenants either downsize or default.
Questions for listing agent
- It's been on market 42 days. Have you received any prior offers? Is the seller open to a 3% concession, seller financing, or rate buy-down credit?
- Built in 1949 — when were the roof, HVAC, electrical panel, plumbing, and water heater last replaced?
- Is there a deadline driving the sale (1031 exchange, divorce, estate, relocation)? That informs how much negotiation room exists.
- Schools are A-rated — typically a magnet for longer-tenancy family renters. What's the average tenant stay here, and is there a school-zone premium baked into asking?
- What's the average days-on-market for RENTAL listings here right now (not sales)? A rising rental-DOM trend means longer vacancies and softer asking-rent achievability than the comps imply.
- What's the recent tenant-quality profile in this submarket — average credit score on applications, eviction rate, late-payment / NSF rate, and stable-employment percentage? A property-management company in the area should have these aggregated.
- How much new apartment / multifamily construction is in the pipeline within 1–3 miles? Heavy new supply (>2% of stock underway) typically softens rents 12–24 months out; light construction supports rent growth.
CashFlowRE · CFR-BPCW2CDSHSDBP5
· Data 2 days ago
cashflowre.app · 2026-05-29