 Multi-family
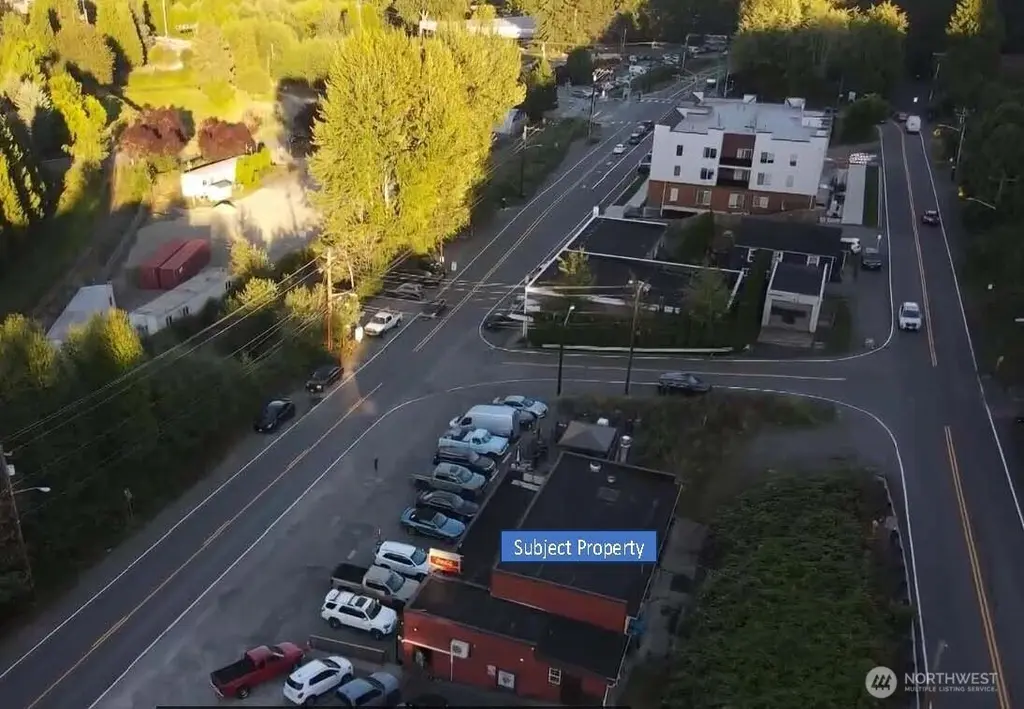
12461 NE Woodinville Dr · Woodinville, WA
Flood risk No data
- FEMA flood zone
- —
- Chance of flooding over 30 yrs
- —
- Est. flood insurance / yr
- —
Fire risk No data
- Est. fire insurance / yr
- —
Heat risk No data
- Hot days now (above threshold)
- —
- Hot days in 30 yrs
- —
Wind risk No data
- Chance of severe wind over 30 yrs
- —
Air-quality risk No data
- Unhealthy air days now
- —
- Unhealthy air days in 30 yrs
- —
Risk factors via First Street. Map © Google.
Why this score? — see what drove the B+ grade
The composite is a weighted blend of 9 inputs, each scored 0–100. Each bar is that input's sub-score; the figure is the points it added to the 100-point composite (weight × sub-score).
- Cash flow +30.0/30.0
- 1% rule +10.0/10.0
- DSCR +10.0/10.0
- ARV discount +7.5/15.0
- Schools +6.7/10.0
- Condition / age +4.8/5.0
- Livability +4.3/5.0
- Rent growth +2.2/5.0
- Appreciation +0.0/10.0
$10,500,000
🖨 Deal sheet 📄 Offer letter ✓ Due diligence
Multi-family units
County records classify this as Multi-Family (2-4 Unit). Listing-text estimate: 1 unit. estimate disagrees with records
Listing remarks
This 1.13-acre development site in the heart of City of Woodinville is fully entitled and approved for 161 units, allowing you to skip years of permitting - with the heavy lifting already done. The development site spans across five contiguous lots consisting of a strong multifamily submarket demand drivers with high desirable community in the city. Woodinville is consistently ranked as Washington’s best place to live, offering a wealthy resident base and easy access to major employers like Microsoft, SpaceX, and the Bothell University of Washington and biotech hub. With a massive shortage of housing in the area and quick access to I-405, this project is perfectly positioned to meet t
Key facts
- Fully entitled
- Five contiguous lots
- 1.14 acre lot
Tags
Property features AI
Finance
- Other: Possible uses: Commercial, Multi-Family, Office, Residential, Retail; MLS lot size source: Seller recorded survey; Zoning jurisdiction: City; Lot size about 1.1405 acres; Elevation measured in feet
- Financial info: Listing terms: Cash; Total expenses listed as $37,000; Gross and monthly rental income not provided
Exterior
- Parking: 230 covered parking spaces; 3 garage spaces
- Utilities: Electric and natural gas; Public water (Woodinville Water District); Sewer connected (Woodinville Water District); Power by Puget Sound Energy; Xfinity cable and internet
- Home design: Residential income property; Multi-family building; Style: 10+ units; Has a view; 7 stories total; Effective year built: 1949
- Construction: Construction materials: see remarks; Roof: see remarks; Foundation information not provided
- Exterior features: Corner lot; Paved; Value in land; See remarks for additional exterior features
Interior
- Heating & cooling: Heating present (details in remarks); Cooling present
- Interior features: Has heating and cooling; See remarks for heating details
Neighborhood map
What this means for you Summary
Snapshot
- This is a multifamily listed at $10.50M. Condition is rated excellent.
Deal economics
- At list price, monthly cash flow is $192k ($2.30M/yr) — positive.
- The deal already cash-flows at list — no discount required.
- Meets the 1% rule at list price ($334k rent vs $10.50M).
- Recommended offer: $10.19M (3.0% below list) — sets the bar for market timing.
- Cap rate 28.2% vs local median 1.2% in Woodinville — top-decile yield for the area; either an underpriced asset or a hidden risk that comps aren't pricing in. Stress-test before assuming the spread holds.
Location & tenants
- Location reads 86/100 on livability (#18 in WA, #349 nationally) — a professional / high-income tenant draw. Strengths: schools A+, amenities A+, commute A+; Watch: cost of living F.
- Northshore School District (suburban): math 69% / reading 78% proficiency, ranked #9 of 291 in WA (top 3%) — strong family-tenant draw, lease renewals of 3-5y typical; only 12% free/reduced lunch — higher-income household profile.
- Market conditions: Rents soft (-1.0%/yr); 192 active listings in the ZIP; 1 comparable units currently listed for rent nearby; high-income renter base; 10,555 units permitted in King County in 2024 (7,119 in 5+ unit buildings).
- At $334,394/mo this rent would consume 2282% of the median local household income ($176k/yr) (locally 588% of renters already pay >50% of income on rent) — very limited rent-growth headroom before tenants either downsize or default.
Forward outlook
- Local home prices are declining (-3.0%/yr); year-one equity from $73k of loan paydown is wiped out by about $315k of value loss. Plan a longer hold.
- King County population projected at +44% by 2050 — long-run rental-demand tailwind backs the buy-and-hold thesis.
- At projected returns (-3.0% appreciation + 0.0% rent growth), your $2.94M cash investment doubles in ~2 years — after that, you're playing with house money.
Negotiation context
- It's been on market 42 days — a 3% lower offer ($10.19M) is reasonable based on typical stale-listing flexibility.
Risks & watch-outs
- Watch-outs: built in 1949 — expect roof / HVAC / electrical / plumbing capex.
Questions for the listing agent
- It's been on market 42 days. Have you received any prior offers? Is the seller open to a 3% concession, seller financing, or rate buy-down credit?
- Built in 1949 — when were the roof, HVAC, electrical panel, plumbing, and water heater last replaced?
- Is there a deadline driving the sale (1031 exchange, divorce, estate, relocation)? That informs how much negotiation room exists.
- Schools are A-rated — typically a magnet for longer-tenancy family renters. What's the average tenant stay here, and is there a school-zone premium baked into asking?
- What's the average days-on-market for RENTAL listings here right now (not sales)? A rising rental-DOM trend means longer vacancies and softer asking-rent achievability than the comps imply.
- What's the recent tenant-quality profile in this submarket — average credit score on applications, eviction rate, late-payment / NSF rate, and stable-employment percentage? A property-management company in the area should have these aggregated.
- How much new apartment / multifamily construction is in the pipeline within 1–3 miles? Heavy new supply (>2% of stock underway) typically softens rents 12–24 months out; light construction supports rent growth.
Investment metrics
- 1% rule
- 3.18% ✓
- Cap rate
- 28.19%
- Cash-on-cash
- 78.21%
- DSCR
- 4.48
- GRM
- 2.6
CMA / ARV
- ARV (median comp)
- $782,708
- List price
- $10,500,000
- Delta
- 1241.50%
- Verdict
- OVERPRICED
- Comps
- 1 within 2.0 mi
Projected returns pro-forma
-3.0% appreciation · 0.0% rent growth · sell at horizon
- IRR
- 74.8%
- Equity multiple
- 4.24×
- Total profit
- $9,527,240
- Equity at exit
- $1,565,584
- IRR
- 77.8%
- Equity multiple
- 7.89×
- Total profit
- $20,243,535
- Equity at exit
- $907,848
Cash invested: $2,940,000 (down + closing). Projections, not guarantees.
Landlord ↔ Tenant lean methodology
- Overall (STATE)
- 28 Tenant-Leaning
- State Washington
- 28 Tenant-Leaning · D+8
- County
- — inherits STATE
- City
- — inherits STATE
ZIP-level market 98072
- Rents YoY
- -1.0%
- Active inventory
- 192
- Price-to-rent
- 421.3×
Monthly cashflow live
- Estimated rent
- $334,394 high interval (Pro) →
- Mortgage (P&I)
- −$55,063
- Tax est. 1.5%
- −$13,125 /mo · $157,500/yr
- Insurance
- −$4,375
- HOA
- −$0
- Vacancy / Maint / Mgmt
- −$70,223
- Net cashflow
- $191,608
Break-even live
161-unit breakdown (identical units grouped — click to expand)
| Units | Beds | Baths | Est. rent |
|---|---|---|---|
| 161× units | 1 | 1 | $334,397 |
| #1 | 1 | 1 | $2,077 |
| #2 | 1 | 1 | $2,077 |
| #3 | 1 | 1 | $2,077 |
| #4 | 1 | 1 | $2,077 |
| #5 | 1 | 1 | $2,077 |
| #6 | 1 | 1 | $2,077 |
| #7 | 1 | 1 | $2,077 |
| #8 | 1 | 1 | $2,077 |
| #9 | 1 | 1 | $2,077 |
| #10 | 1 | 1 | $2,077 |
| #11 | 1 | 1 | $2,077 |
| #12 | 1 | 1 | $2,077 |
| #13 | 1 | 1 | $2,077 |
| #14 | 1 | 1 | $2,077 |
| #15 | 1 | 1 | $2,077 |
| #16 | 1 | 1 | $2,077 |
| #17 | 1 | 1 | $2,077 |
| #18 | 1 | 1 | $2,077 |
| #19 | 1 | 1 | $2,077 |
| #20 | 1 | 1 | $2,077 |
| #21 | 1 | 1 | $2,077 |
| #22 | 1 | 1 | $2,077 |
| #23 | 1 | 1 | $2,077 |
| #24 | 1 | 1 | $2,077 |
| #25 | 1 | 1 | $2,077 |
| #26 | 1 | 1 | $2,077 |
| #27 | 1 | 1 | $2,077 |
| #28 | 1 | 1 | $2,077 |
| #29 | 1 | 1 | $2,077 |
| #30 | 1 | 1 | $2,077 |
| #31 | 1 | 1 | $2,077 |
| #32 | 1 | 1 | $2,077 |
| #33 | 1 | 1 | $2,077 |
| #34 | 1 | 1 | $2,077 |
| #35 | 1 | 1 | $2,077 |
| #36 | 1 | 1 | $2,077 |
| #37 | 1 | 1 | $2,077 |
| #38 | 1 | 1 | $2,077 |
| #39 | 1 | 1 | $2,077 |
| #40 | 1 | 1 | $2,077 |
| #41 | 1 | 1 | $2,077 |
| #42 | 1 | 1 | $2,077 |
| #43 | 1 | 1 | $2,077 |
| #44 | 1 | 1 | $2,077 |
| #45 | 1 | 1 | $2,077 |
| #46 | 1 | 1 | $2,077 |
| #47 | 1 | 1 | $2,077 |
| #48 | 1 | 1 | $2,077 |
| #49 | 1 | 1 | $2,077 |
| #50 | 1 | 1 | $2,077 |
| #51 | 1 | 1 | $2,077 |
| #52 | 1 | 1 | $2,077 |
| #53 | 1 | 1 | $2,077 |
| #54 | 1 | 1 | $2,077 |
| #55 | 1 | 1 | $2,077 |
| #56 | 1 | 1 | $2,077 |
| #57 | 1 | 1 | $2,077 |
| #58 | 1 | 1 | $2,077 |
| #59 | 1 | 1 | $2,077 |
| #60 | 1 | 1 | $2,077 |
| #61 | 1 | 1 | $2,077 |
| #62 | 1 | 1 | $2,077 |
| #63 | 1 | 1 | $2,077 |
| #64 | 1 | 1 | $2,077 |
| #65 | 1 | 1 | $2,077 |
| #66 | 1 | 1 | $2,077 |
| #67 | 1 | 1 | $2,077 |
| #68 | 1 | 1 | $2,077 |
| #69 | 1 | 1 | $2,077 |
| #70 | 1 | 1 | $2,077 |
| #71 | 1 | 1 | $2,077 |
| #72 | 1 | 1 | $2,077 |
| #73 | 1 | 1 | $2,077 |
| #74 | 1 | 1 | $2,077 |
| #75 | 1 | 1 | $2,077 |
| #76 | 1 | 1 | $2,077 |
| #77 | 1 | 1 | $2,077 |
| #78 | 1 | 1 | $2,077 |
| #79 | 1 | 1 | $2,077 |
| #80 | 1 | 1 | $2,077 |
| #81 | 1 | 1 | $2,077 |
| #82 | 1 | 1 | $2,077 |
| #83 | 1 | 1 | $2,077 |
| #84 | 1 | 1 | $2,077 |
| #85 | 1 | 1 | $2,077 |
| #86 | 1 | 1 | $2,077 |
| #87 | 1 | 1 | $2,077 |
| #88 | 1 | 1 | $2,077 |
| #89 | 1 | 1 | $2,077 |
| #90 | 1 | 1 | $2,077 |
| #91 | 1 | 1 | $2,077 |
| #92 | 1 | 1 | $2,077 |
| #93 | 1 | 1 | $2,077 |
| #94 | 1 | 1 | $2,077 |
| #95 | 1 | 1 | $2,077 |
| #96 | 1 | 1 | $2,077 |
| #97 | 1 | 1 | $2,077 |
| #98 | 1 | 1 | $2,077 |
| #99 | 1 | 1 | $2,077 |
| #100 | 1 | 1 | $2,077 |
| #101 | 1 | 1 | $2,077 |
| #102 | 1 | 1 | $2,077 |
| #103 | 1 | 1 | $2,077 |
| #104 | 1 | 1 | $2,077 |
| #105 | 1 | 1 | $2,077 |
| #106 | 1 | 1 | $2,077 |
| #107 | 1 | 1 | $2,077 |
| #108 | 1 | 1 | $2,077 |
| #109 | 1 | 1 | $2,077 |
| #110 | 1 | 1 | $2,077 |
| #111 | 1 | 1 | $2,077 |
| #112 | 1 | 1 | $2,077 |
| #113 | 1 | 1 | $2,077 |
| #114 | 1 | 1 | $2,077 |
| #115 | 1 | 1 | $2,077 |
| #116 | 1 | 1 | $2,077 |
| #117 | 1 | 1 | $2,077 |
| #118 | 1 | 1 | $2,077 |
| #119 | 1 | 1 | $2,077 |
| #120 | 1 | 1 | $2,077 |
| #121 | 1 | 1 | $2,077 |
| #122 | 1 | 1 | $2,077 |
| #123 | 1 | 1 | $2,077 |
| #124 | 1 | 1 | $2,077 |
| #125 | 1 | 1 | $2,077 |
| #126 | 1 | 1 | $2,077 |
| #127 | 1 | 1 | $2,077 |
| #128 | 1 | 1 | $2,077 |
| #129 | 1 | 1 | $2,077 |
| #130 | 1 | 1 | $2,077 |
| #131 | 1 | 1 | $2,077 |
| #132 | 1 | 1 | $2,077 |
| #133 | 1 | 1 | $2,077 |
| #134 | 1 | 1 | $2,077 |
| #135 | 1 | 1 | $2,077 |
| #136 | 1 | 1 | $2,077 |
| #137 | 1 | 1 | $2,077 |
| #138 | 1 | 1 | $2,077 |
| #139 | 1 | 1 | $2,077 |
| #140 | 1 | 1 | $2,077 |
| #141 | 1 | 1 | $2,077 |
| #142 | 1 | 1 | $2,077 |
| #143 | 1 | 1 | $2,077 |
| #144 | 1 | 1 | $2,077 |
| #145 | 1 | 1 | $2,077 |
| #146 | 1 | 1 | $2,077 |
| #147 | 1 | 1 | $2,077 |
| #148 | 1 | 1 | $2,077 |
| #149 | 1 | 1 | $2,077 |
| #150 | 1 | 1 | $2,077 |
| #151 | 1 | 1 | $2,077 |
| #152 | 1 | 1 | $2,077 |
| #153 | 1 | 1 | $2,077 |
| #154 | 1 | 1 | $2,077 |
| #155 | 1 | 1 | $2,077 |
| #156 | 1 | 1 | $2,077 |
| #157 | 1 | 1 | $2,077 |
| #158 | 1 | 1 | $2,077 |
| #159 | 1 | 1 | $2,077 |
| #160 | 1 | 1 | $2,077 |
| #161 | 1 | 1 | $2,077 |
| Total (161 units) | $334,394 | ||
UW: 25.0% down · 7.5% · 30yr · 1.5% tax · 5.0% vac · 8.0% maint · 8.0% mgmt
Financing live
Cash to close
- Down payment
- $2,625,000
- Closing costs
- $315,000
- Reserves months
- —
- Total cash needed
- —
Loan-product check · same deal, 3 products live
Conventional
25% down · 7.5% · 30yr
- Down + closing
- —
- Monthly P&I
- —
- Monthly cashflow
- —
- DSCR
- —
- Eligible?
- —
Personal DTI + credit; lowest rate.
DSCR
20% down · 8.5% · 30yr
- Down + closing
- —
- Monthly P&I
- —
- Monthly cashflow
- —
- DSCR
- —
- Eligible?
- —
No personal income docs; deal must DSCR.
Hard money
10% down · 12.0% · 12mo
- Down + closing
- —
- Monthly P&I
- —
- Monthly cashflow
- —
- DSCR
- —
- Eligible?
- —
Short-term bridge; refi at stabilization.
Rent comps 1 comps
| Address | Beds | Baths | Sqft | Rent | $/sqft | DOM | Units | Dist |
|---|---|---|---|---|---|---|---|---|
| 12954 NE 203rd St Woodinville, WA | 3.0 | 2.5 | 2450 | $3,850 | $1.57 | 43d | 1 | 1.49mi |
Listing history 15 events
-
2026-06-18days on market $10,500,000 Active 42 DOM
-
2026-06-17days on market $10,500,000 Active 41 DOM
-
2026-06-16days on market $10,500,000 Active 40 DOM
-
2026-06-15days on market $10,500,000 Active 39 DOM
-
2026-06-13days on market $10,500,000 Active 37 DOM
-
2026-06-13days on market $10,500,000 Active 36 DOM
-
2026-06-09days on market $10,500,000 Active 33 DOM
-
2026-06-08days on market $10,500,000 Active 32 DOM
-
2026-06-07days on market $10,500,000 Active 31 DOM
-
2026-06-04days on market $10,500,000 Active 28 DOM
-
2026-06-03days on market $10,500,000 Active 27 DOM
-
2026-06-02days on market $10,500,000 Active 26 DOM
-
2026-06-01days on market $10,500,000 Active 25 DOM
-
2026-05-31days on market $10,500,000 Active 24 DOM
-
2026-05-07$10,500,000 Active
ⓘ Source: listings_history table (triggers on properties + properties_extension) + one-shot
backfill from property_details.listing_events for pre-trigger history.
Nearby sold comps map
Loading sold comps map…
Walkable amenities ~0.75 mi
Loading nearby amenities…
Taxation est. · year 1
- Rental income
- $4,012,728
- − Mortgage interest
- −$588,163
- − Property taxes
- −$157,500
- − Insurance
- −$52,500
- − Repairs & maintenance
- −$321,018
- − Management
- −$321,018
- − Depreciation
- −$305,455
- Taxable income
- $2,267,074
- Est. tax owed @ 24.0%
- −$544,098
- After-tax cash flow
- $1,755,200/yr
For passive investors: Depreciation is non-cash, so a rental often shows a tax loss while cash-flowing — sheltering income. Rental losses are passive: they offset passive income freely, and up to $25,000/yr can offset ordinary (W-2) income if you actively participate and your MAGI is under $100k (phasing out to $0 by $150k); unused losses carry forward. On sale, claimed depreciation is recaptured at up to 25%, and gains may owe capital-gains tax (a 1031 exchange can defer both). Figures are a year-1 estimate at your 24.0% rate — not tax advice; consult a CPA.
Condition & rehab AI · 4 photos
This multi-family development site in Woodinville is fully entitled and approved for 161 units, offering a prime location with high demand and easy access to major employers. The property is in excellent condition with modern design and no visible repairs or maintenance needed.
Value-add opportunities
- Both Landscaping improvements — Enhances curb appeal and adds value
- Both Interior updates — Modernizes interior spaces and enhances rental appeal
Renovation cost estimate screening
Value-add ROI direction
- Both Landscaping improvements — Enhances curb appeal and adds value ↑
- Both Interior updates — Modernizes interior spaces and enhances rental appeal ↑
ⓘ Cost ranges are severity-bucket heuristics (US national rule-of-thumb). Get contractor quotes + a written scope before underwriting a rehab budget.
Schools (NCES district)
- District
- Northshore School District
- NCES district ID
- 5305910
- Math proficiency
- 69% ▼ -3.00%
- Reading proficiency
- 78% ▼ -1.00%
- Median HH income
- $92,951
- Composite
- 67.41/100
- National rank
- #826
- State rank
- #9 of 291 in WA
Livability — Woodinville
- Score
- 86/100
- State rank
- #18
- US rank
- #349
Category grades
Schools grade is shown separately in the Schools card above.
Census & demographics
- Census place
- Woodinville, WA
- County
- King County · 2,251,916 people
- City population
- 24,446
- Metro
- Seattle-Tacoma-Bellevue, WA
- Population (ZIP)
- 24,446
- Household income
- $175,805
- Rent vs Own
- Severe rent burden
- 588.0
Population outlook (King County) Hauer SSP2
- Today (2025)
- 2,576,485 people
- By 2030
- 2,803,316 · +8.8%
- By 2040
- 3,255,921 · +26.4%
- By 2050
- 3,706,444 · +43.9%
- By 2075
- 4,746,063 · +84.2%
- By 2100
- 5,407,730 · +109.9%
Race, ethnicity, and origin ACS 2023
- Neighborhood character
- Predominantly White (70%)
- Race & ethnicity
- White 70% Asian 13% Two or more races 9% Hispanic / Latino 8% Black 1%
- Hispanic origin (detail)
- Mexican 7%
- Common ancestry
- Italian 5% Portuguese 4% Romanian 4%
- Foreign-born
- 20% · Canada, China, South Korea
- Languages at home
- 77% English-only · Russian/Polish/Slavic 5% Chinese 4% Spanish 4%
Political lean MEDSL · King
- 2024 margin
- Solid D (+51.7) · D 74.2% · R 22.5% · Other 3.4%
- 2008→2024 swing
- +9.6pp toward D · 2008: 42.1pp · 2024: 51.7pp
- All cycles
- 2024: D+51.7 2020: D+52.7 2016: D+50.4 2012: D+39.9 2008: D+42.1
Not yet ingested
- Civics
- —
Market trends
- HPI YoY
- ▼ -887.82%
- Current HPI
- 369.5283
- Rent YoY
- ▼ -1.00%
- Metro
- Seattle-Tacoma-Bellevue, WA
- State GDP YoY
- ▲ 4.65%
- F500 in state
- 22
Industry mix (Fortune 500 HQ in WA)
| Industry | F500 HQs | Revenue |
|---|---|---|
| Retail | 2 | $269B |
|
||
| Technology / Retail | 1 | $638B |
|
||
| Technology | 1 | $245B |
|
||
| Telecommunications | 1 | $38B |
|
||
| Food / Beverage | 1 | $36B |
|
||
| Automotive / Trucks | 1 | $34B |
|
||
Price history
1 event — show timeline
- 2026-05-07 Listed $10,500,000 NWMLS as Distributed by MLS Grid
Cash-flow waterfall
monthlySold comps — $/sqft
last 12 mo · ≤1 miLoading sold comps…