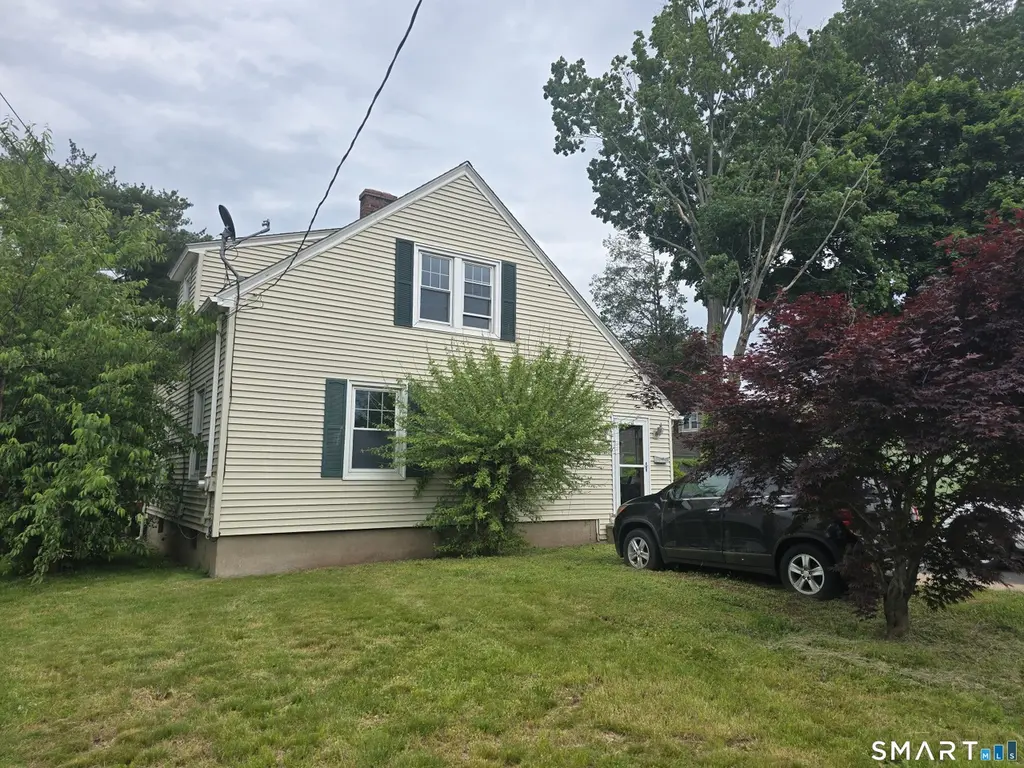
14 Center Ct
Newington, CT 06111
$250,000C+
3 bd · 1.0 ba ·
1,201 sqft ·
Built 1927
· SingleFamily
· Under Contract
· 14 DOM
Cashflow @ list (25.0% down · 7.5%)
Estimated rent
$2,649/mo
Mortgage (P&I)
−$1,311
Tax + insurance
−$467
HOA
−$0
Vac / Maint / Mgmt
−$556
Net cashflow
$314/mo
Annual
$3,772/yr
Cap rate
7.80%
Cash-on-cash
5.39%
DSCR
1.24
1% rule
1.06%
Cash to close
$70,000
Investor read
- This is a 3-bed/1.0-bath single-family listed at $250k.
- At list price, monthly cash flow is $314 ($4k/yr) — positive.
- The deal already cash-flows at list — no discount required.
- Meets the 1% rule at list price ($3k rent vs $250k).
- Only 14 days on market — expect competitive offers; lowballing is unlikely to land.
- Local home prices are declining (-3.0%/yr); year-one equity from $2k of loan paydown is wiped out by about $8k of value loss. Plan a longer hold.
- Location reads 79/100 on livability (#30 in CT, #2,143 nationally) — a middle-class / working-renter tenant base. Strengths: employment A+, housing A+, health & safety A+; Watch: amenities F, commute F.
- Newington School District (suburban): math 38% / reading 53% proficiency, ranked #87 of 153 in CT (top 57%) — families likely to look elsewhere, expect single-tenant / working-renter base with shorter leases; only 15% free/reduced lunch — higher-income household profile.
- Zoned schools: Elizabeth Green School (math 42% / reading 47%, grade F, #272 of 553 statewide, top 50%, 286 students, 37% FRL); Newington High School (math 52% / reading 70%, grade C+, #43 of 194 statewide, top 22%, 1,327 students, 32% FRL) — zoned schools average 35% FRL vs 15% district-wide (19 pts higher); higher-poverty schools than district average — tighter screening recommended.
- Watch-outs: built in 1927 — expect roof / HVAC / electrical / plumbing capex.
- Market conditions: Rents flat; 94 active listings in the ZIP; 5 comparable units currently listed for rent nearby; rentals leasing fast (median 3d on market — plan ~1-2 weeks tenant-placement turnaround); solid renter incomes; 1,867 units permitted in Capitol Planning Region in 2024 (1,399 in 5+ unit buildings).
- Current owner paid $112k; list at $250k implies a 122% gain — meaningful room to come down on a strong offer.
- Climate carrying-cost: major wind risk, 27% chance of damaging wind over 30y; extreme-heat days projected 7→17/yr by 2055 (HVAC capex compounding) — expect insurance premiums to compound above CPI over the hold.
- Cap rate 7.8% vs local median 4.4% in Newington — top-decile yield for the area; either an underpriced asset or a hidden risk that comps aren't pricing in. Stress-test before assuming the spread holds.
- This rent runs 31% of the median local income ($103k/yr) — at the standard rent-burdened threshold; future hikes will face affordability resistance.
Questions for listing agent
- Built in 1927 — when were the roof, HVAC, electrical panel, plumbing, and water heater last replaced?
- Is there a deadline driving the sale (1031 exchange, divorce, estate, relocation)? That informs how much negotiation room exists.
- What's the average days-on-market for RENTAL listings here right now (not sales)? A rising rental-DOM trend means longer vacancies and softer asking-rent achievability than the comps imply.
- What's the recent tenant-quality profile in this submarket — average credit score on applications, eviction rate, late-payment / NSF rate, and stable-employment percentage? A property-management company in the area should have these aggregated.
- How much new for-sale + rental construction is in the pipeline within 1–3 miles? Heavy new supply typically softens prices + rents 12–24 months out; constrained supply supports both.
CashFlowRE · CFR-BR2TJ4CHEAM3PR
· Data 4 days ago
cashflowre.app · 2026-05-29