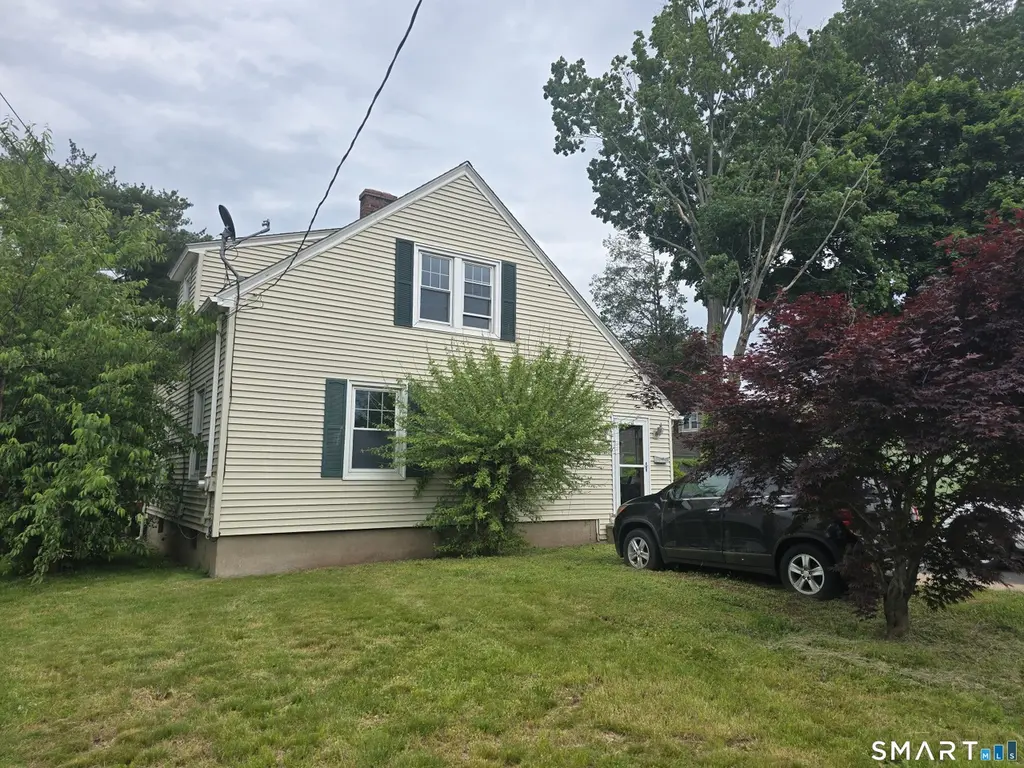
14 Center Ct · Newington, CT
Flood risk 1/10 · Minimal
- FEMA flood zone
- X (unshaded)
- Chance of flooding over 30 yrs
- 0.0%
- Est. flood insurance / yr
- $473 – $860
Fire risk 1/10 · Minimal
- Est. fire insurance / yr
- $829 – $1,539
Heat risk 6/10 · Moderate
- Hot days now (above 96°F)
- 7 days/yr
- Hot days in 30 yrs
- 17 days/yr
Wind risk 6/10 · Moderate
- Chance of severe wind over 30 yrs
- 27.0%
Air-quality risk 3/10 · Minor
- Unhealthy air days now
- 3 days/yr
- Unhealthy air days in 30 yrs
- 4 days/yr
Risk factors via First Street. Map © Google.
Why this score? — see what drove the C+ grade
The composite is a weighted blend of 9 inputs, each scored 0–100. Each bar is that input's sub-score; the figure is the points it added to the 100-point composite (weight × sub-score).
- Cash flow +20.2/30.0
- ARV discount +15.0/15.0
- DSCR +6.4/10.0
- 1% rule +5.6/10.0
- Schools +4.1/10.0
- Livability +4.0/5.0
- Rent growth +2.7/5.0
- Condition / age +2.5/5.0
- Appreciation +0.0/10.0
$250,000
🖨 Deal sheet 📄 Offer letter ✓ Due diligence
Listing remarks
PRICED TO SELL! Opportunity awaits in the heart of Newington! This 3-bedroom, 1-bath home offers tremendous potential for investors, flippers, or owner-occupants looking to build equity with some updates and TLC. Conveniently located in the center of town, you'll enjoy easy walking access to local shops, restaurants, parks and other amenities that make Newington such a desirable place to live. The home features a functional layout and solid bones, providing the perfect canvas to renovate and customize to your vision. Whether you're searching for your next investment project or a place to make your own, this property presents an excellent value in a prime location. Bring your ideas and unloc
Key facts
- Solid bones
- Functional layout
- Parks
Tags
Property features AI
Finance
- Other: Property listed for sale as single-family
Exterior
- Parking: Detached garage (1-car)
- Utilities: Public water connected; Public sewer connected
- Home design: Single-family home
- Construction: Frame construction; Asphalt shingle roof; Concrete and masonry foundation; White exterior
- Exterior features: Level lot; Deck; White vinyl siding
Interior
- Kitchen: Electric range; Range hood; Refrigerator; Dishwasher
- Bedrooms: Three bedrooms
- Bathrooms: One full bathroom
- Heating & cooling: Hot water heating (oil-fired); Window cooling unit; Oil hot water and oil hot water heater located in basement
- Interior features: Six total rooms; One fireplace; Full, unfinished basement; Has attic with access via hatch
- Laundry & utility: Washer and electric dryer
Neighborhood map
What this means for you Summary
Snapshot
- This is a 3-bed/1.0-bath single-family listed at $250k.
Deal economics
- At list price, monthly cash flow is $314 ($4k/yr) — positive.
- The deal already cash-flows at list — no discount required.
- Meets the 1% rule at list price ($3k rent vs $250k).
- Cap rate 7.8% vs local median 4.4% in Newington — top-decile yield for the area; either an underpriced asset or a hidden risk that comps aren't pricing in. Stress-test before assuming the spread holds.
Location & tenants
- Location reads 79/100 on livability (#30 in CT, #2,143 nationally) — a middle-class / working-renter tenant base. Strengths: employment A+, housing A+, health & safety A+; Watch: amenities F, commute F.
- Newington School District (suburban): math 38% / reading 53% proficiency, ranked #87 of 153 in CT (top 57%) — families likely to look elsewhere, expect single-tenant / working-renter base with shorter leases; only 15% free/reduced lunch — higher-income household profile.
- Zoned schools: Elizabeth Green School (math 42% / reading 47%, grade F, #272 of 553 statewide, top 50%, 286 students, 37% FRL); Newington High School (math 52% / reading 70%, grade C+, #43 of 194 statewide, top 22%, 1,327 students, 32% FRL) — zoned schools average 35% FRL vs 15% district-wide (19 pts higher); higher-poverty schools than district average — tighter screening recommended.
- Market conditions: Rents flat; 94 active listings in the ZIP; 5 comparable units currently listed for rent nearby; rentals leasing fast (median 3d on market — plan ~1-2 weeks tenant-placement turnaround); solid renter incomes; 1,867 units permitted in Capitol Planning Region in 2024 (1,399 in 5+ unit buildings).
- This rent runs 31% of the median local income ($103k/yr) — at the standard rent-burdened threshold; future hikes will face affordability resistance.
Forward outlook
- Local home prices are declining (-3.0%/yr); year-one equity from $2k of loan paydown is wiped out by about $8k of value loss. Plan a longer hold.
Negotiation context
- Only 14 days on market — expect competitive offers; lowballing is unlikely to land.
- Current owner paid $112k; list at $250k implies a 122% gain — meaningful room to come down on a strong offer.
Risks & watch-outs
- Watch-outs: built in 1927 — expect roof / HVAC / electrical / plumbing capex.
- Climate carrying-cost: major wind risk, 27% chance of damaging wind over 30y; extreme-heat days projected 7→17/yr by 2055 (HVAC capex compounding) — expect insurance premiums to compound above CPI over the hold.
Questions for the listing agent
- Built in 1927 — when were the roof, HVAC, electrical panel, plumbing, and water heater last replaced?
- Is there a deadline driving the sale (1031 exchange, divorce, estate, relocation)? That informs how much negotiation room exists.
- What's the average days-on-market for RENTAL listings here right now (not sales)? A rising rental-DOM trend means longer vacancies and softer asking-rent achievability than the comps imply.
- What's the recent tenant-quality profile in this submarket — average credit score on applications, eviction rate, late-payment / NSF rate, and stable-employment percentage? A property-management company in the area should have these aggregated.
- How much new for-sale + rental construction is in the pipeline within 1–3 miles? Heavy new supply typically softens prices + rents 12–24 months out; constrained supply supports both.
Investment metrics
- 1% rule
- 1.06% ✓
- Cap rate
- 7.80%
- Cash-on-cash
- 5.39%
- DSCR
- 1.24
- GRM
- 7.9
CMA / ARV
- ARV (on-the-fly)
- $372,310
- Comps found
- 12
Show comp detail 12 sales within ~0.75 mi
| Address | Dist | Beds/Ba | Sqft | Sold | Price | $/sf | Match |
|---|---|---|---|---|---|---|---|
| 123 Ellsworth St | 0.23mi | 3/1.5 | 1,132 (-6%) | 6mo | $365,000 | $322 | 73 |
| 72 Hawley St | 0.21mi | 3/1.5 | 1,288 (+7%) | 9mo | $303,000 | $235 | 69 |
| 88 Hawley St | 0.24mi | 3/1.5 | 1,333 (+11%) | 1mo | $370,000 | $278 | 68 |
| 36 Hartt Ln | 0.27mi | 3/2.0 | 1,305 (+9%) | 7mo | $405,000 | $310 | 63 |
| 42 Sunset Rd | 0.62mi | 3/2.5 | 1,190 (-1%) | 2mo | $395,000 | $332 | 62 |
| 681 Main St | 0.28mi | 2/1.0 (-1) | 1,050 (-13%) | 1mo | $266,000 | $253 | 60 |
| 140 Dowd St | 0.61mi | 3/1.0 | 1,272 (+6%) | 2mo | $405,000 | $318 | 60 |
| 203 Brentwood Rd | 0.59mi | 3/1.0 | 1,296 (+8%) | 1mo | $401,000 | $309 | 58 |
| 128 Wilson Ave | 0.64mi | 3/1.0 | 1,286 (+7%) | 0mo | $367,500 | $286 | 58 |
| 105 Gilbert Rd | 0.69mi | 3/2.0 | 1,216 (+1%) | 5mo | $360,000 | $296 | 57 |
| 180 Connecticut Ave | 0.47mi | 3/1.0 | 1,091 (-9%) | 9mo | $360,000 | $330 | 56 |
| 70 Woodland St | 0.75mi | 3/2.0 | 1,307 (+9%) | 4mo | $425,000 | $325 | 43 |
Match score weights: distance 35% · size 25% · config 20% · recency 20%. Top-matched comps best support the ARV.
Projected returns pro-forma
-3.0% appreciation · 0.98% rent growth · sell at horizon
- IRR
- -10.3%
- Equity multiple
- 0.63×
- Total profit
- $-25,700
- Equity at exit
- $37,276
- IRR
- -4.1%
- Equity multiple
- 0.76×
- Total profit
- $-17,110
- Equity at exit
- $21,615
Cash invested: $70,000 (down + closing). Projections, not guarantees.
Landlord ↔ Tenant lean methodology
- Overall (STATE)
- 27 Tenant-Leaning
- State Connecticut
- 27 Tenant-Leaning · D+7
- County
- — inherits STATE
- City
- — inherits STATE
ZIP-level market 06111
- Rents YoY
- 1.0%
- Active inventory
- 94
- Price-to-rent
- 7.9×
Monthly cashflow live
- Estimated rent
- $2,649 high interval (Pro) →
- Mortgage (P&I)
- −$1,311
- Tax from tax record
- −$363 /mo · $4,358/yr
- Insurance
- −$104
- HOA
- −$0
- Vacancy / Maint / Mgmt
- −$556
- Net cashflow
- $314
Break-even live
UW: 25.0% down · 7.5% · 30yr · 1.5% tax · 5.0% vac · 8.0% maint · 8.0% mgmt
Financing live
Cash to close
- Down payment
- $62,500
- Closing costs
- $7,500
- Reserves months
- —
- Total cash needed
- —
Loan-product check · same deal, 3 products live
Conventional
25% down · 7.5% · 30yr
- Down + closing
- —
- Monthly P&I
- —
- Monthly cashflow
- —
- DSCR
- —
- Eligible?
- —
Personal DTI + credit; lowest rate.
DSCR
20% down · 8.5% · 30yr
- Down + closing
- —
- Monthly P&I
- —
- Monthly cashflow
- —
- DSCR
- —
- Eligible?
- —
No personal income docs; deal must DSCR.
Hard money
10% down · 12.0% · 12mo
- Down + closing
- —
- Monthly P&I
- —
- Monthly cashflow
- —
- DSCR
- —
- Eligible?
- —
Short-term bridge; refi at stabilization.
Rent comps 5 comps
| Address | Beds | Baths | Sqft | Rent | $/sqft | DOM | Units | Dist |
|---|---|---|---|---|---|---|---|---|
| 215 Lowrey Pl Newington, CT | 1.0–2.0 | 1.0 | 835 | $2,195 | $2.63 | 2d | 1 | 0.43mi |
| 310 Connecticut Ave Newington, CT | 3.0 | 2.0 | 1144 | $2,400 | $2.10 | 3d | 1 | 0.75mi |
| 92 Indian Hill Rd Newington, CT | 3.0 | 1.0 | 1250 | $2,800 | $2.24 | 44d | 1 | 1.14mi |
| 1 Barrington Dr Unit B Wethersfield, CT | 2.0 | 2.5 | 1468 | $2,500 | $1.70 | 14d | 1 | 1.30mi |
| 83 Main St Newington, CT | 1.0–2.0 | 1.0 | 825 | $2,195 | $2.66 | 2d | 1 | 1.44mi |
Listing history 11 events
-
2026-06-16statusdays on market $250,000 Under Contract 14 DOM
-
2026-06-15days on market $250,000 Active 13 DOM
-
2026-06-13days on market $250,000 Active 11 DOM
-
2026-06-13pricedays on market $250,000 Active 10 DOM
-
2026-06-10days on market $300,000 Active 8 DOM
-
2026-06-09days on market $300,000 Active 7 DOM
-
2026-06-08days on market $300,000 Active 6 DOM
-
2026-06-07days on market $300,000 Active 5 DOM
-
2026-06-05days on market $300,000 Active 2 DOM
-
2026-06-02remarks 699-char remark
-
2026-06-02$300,000 Active 1 DOM
ⓘ Source: listings_history table (triggers on properties + properties_extension) + one-shot
backfill from property_details.listing_events for pre-trigger history.
Tax reassessment forecast CT · Partial reset (capped growth)
- Current annual tax
- $4,358 · $363/mo
- Projected year-2 tax
- $4,854 · $404/mo
- Expected delta
- +$496/yr (+$41/mo · 11.4%)
ⓘ Screening estimate from a state-policy table — verify with the county assessor before closing.
Climate risk First Street
- Flood 1/10 Low FEMA zone X (unshaded) · 0% chance over 30 yrs
- Wildfire 1/10 Low
- Heat 6/10 Major 7 d/yr ≥96°F today · 17 d/yr by 30 yrs out
- Wind 6/10 Major 27% chance of damaging wind over 30 yrs
- Air quality 3/10 Moderate 3 unhealthy d/yr today · 4 by 30 yrs out
Nearby sold comps map
Loading sold comps map…
Walkable amenities ~0.75 mi
Loading nearby amenities…
Taxation est. · year 1
- Rental income
- $31,787
- − Mortgage interest
- −$14,004
- − Property taxes
- −$4,358
- − Insurance
- −$1,250
- − Repairs & maintenance
- −$2,543
- − Management
- −$2,543
- − Depreciation
- −$7,273
- Taxable loss
- −$183
- Est. tax savings @ 24.0%
- +$44
- After-tax cash flow
- $3,816/yr
For passive investors: Depreciation is non-cash, so a rental often shows a tax loss while cash-flowing — sheltering income. Rental losses are passive: they offset passive income freely, and up to $25,000/yr can offset ordinary (W-2) income if you actively participate and your MAGI is under $100k (phasing out to $0 by $150k); unused losses carry forward. On sale, claimed depreciation is recaptured at up to 25%, and gains may owe capital-gains tax (a 1031 exchange can defer both). Figures are a year-1 estimate at your 24.0% rate — not tax advice; consult a CPA.
Schools (NCES district)
- District
- Newington School District
- NCES district ID
- 0902880
- Math proficiency
- 38% ▼ -14.00%
- Reading proficiency
- 53% ▼ -6.00%
- Median HH income
- $74,751
- Composite
- 41.37/100
- National rank
- #3489
- State rank
- #87 of 153 in CT
Livability — Newington
- Score
- 79/100
- State rank
- #30
- US rank
- #2143
Category grades
Schools grade is shown separately in the Schools card above.
Census & demographics
- Census place
- Newington, CT
- County
- Hartford County · 754,208 people
- City population
- 30,896
- Metro
- Hartford-East Hartford-Middletown, CT
- Population (ZIP)
- 30,896
- Household income
- $102,884
- Rent vs Own
- Severe rent burden
- 553.0
Population outlook (Capitol County) Hauer SSP2
- By 2040
- 1,063,519
Race, ethnicity, and origin ACS 2023
- Neighborhood character
- Predominantly White (72%)
- Race & ethnicity
- White 72% Hispanic / Latino 12% Two or more races 8% Asian 7% Black 4%
- Hispanic origin (detail)
- Mexican 1% Puerto Rican 5%
- Common ancestry
- Romanian 12% Lithuanian 7% Russian 3%
- Foreign-born
- 20% · Canada, Jamaica, China
- Languages at home
- 72% English-only · Spanish 8% Other Indo-European 8% Russian/Polish/Slavic 7%
Political lean MEDSL · Capitol
- 2024 margin
- Strong D (+21.9) · D 60.1% · R 38.2% · Other 1.7%
- All cycles
- 2024: D+21.9
Not yet ingested
- Civics
- —
Market trends
- HPI YoY
- ▼ -194.94%
- Current HPI
- 185.3332
- Rent YoY
- ▲ 0.98%
- Metro
- Hartford-East Hartford-Middletown, CT
- State GDP YoY
- ▲ 1.06%
- F500 in state
- 38
Industry mix (Fortune 500 HQ in CT)
| Industry | F500 HQs | Revenue |
|---|---|---|
| Industrial Machinery | 4 | $38B |
|
||
| Insurance | 3 | $71B |
|
||
| Financial Services | 2 | $25B |
|
||
| Transportation / Logistics | 2 | $18B |
|
||
| Healthcare | 1 | $247B |
|
||
| Telecommunications | 1 | $55B |
|
||
Price history
+166.7% since first listed2 events — show timeline
- 2026-06-01 Listed $300,000 Smart MLS
- 2002-05-15 Sold (Public Records) $112,500 Public Records
Property tax history
+1.4%/yrLatest (2025): $4,358 · +0.8% YoY. Source: county tax records.
Cash-flow waterfall
monthlySold comps — $/sqft
last 12 mo · ≤1 miLoading sold comps…