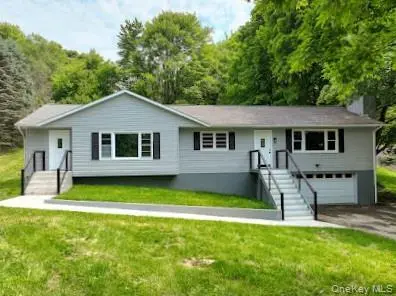
166 Hibernia Rd
Salt Point, NY 12578
$420,000C-
3 bd · 1.0 ba ·
1,572 sqft ·
Built 1963
· SingleFamily
· Pending
· 242 DOM
Cashflow @ list (25.0% down · 7.5%)
Estimated rent
$3,500/mo
Mortgage (P&I)
−$2,203
Tax + insurance
−$723
HOA
−$0
Vac / Maint / Mgmt
−$735
Net cashflow
$-160/mo
Annual
$-1,923/yr
Cap rate
5.84%
Cash-on-cash
-1.64%
DSCR
0.93
1% rule
0.83%
Cash to close
$117,600
Investor read
- This is a 3-bed/1.0-bath single-family listed at $420k.
- At list price, monthly cash flow is $-160 ($-2k/yr) — negative.
- To cash-flow at today's rent, offer at most $392k (6.7% below list).
- To meet the 1% rule (rent ≥ 1% of price), the offer needs to be $350k (16.7% below list).
- It's been on market 242 days — a 12% lower offer ($370k) is reasonable based on typical stale-listing flexibility.
- Recommended offer: $350k (16.7% below list) — sets the bar for 1% rule.
- In year one you build about $45k of equity ($3k loan paydown + $42k appreciation (10.0% local appreciation)).
- Location reads 34/100 on livability (#1,193 in NY) — a limited-amenity area; tenant pool skews transient or value-seeking. Strengths: crime A; Watch: schools F, amenities F, commute F.
- Hyde Park Central School District (rural): math 43% / reading 62% proficiency, ranked #316 of 590 in NY (top 54%) — acceptable for families but not a draw, mixed tenant base, ~2y average lease.
- Market conditions: 19 active listings in the ZIP; 1 comparable units currently listed for rent nearby; 620 units permitted in Dutchess County in 2024 (242 in 5+ unit buildings).
- Dutchess County population projected at -11% by 2050 — secular population decline; favor cash flow + early exit over multi-decade hold.
- 4 sale attempts since 2y ago; this cycle's ask has dropped $55k (12%) from the opening price — seller is motivated, your offer sets the floor, not the list.
- Current owner paid $252k; list at $420k implies a 67% gain — meaningful room to come down on a strong offer.
- By year 2, paydown + projected appreciation supports a ~$72k cash-out refi (75% LTV) — recoverable capital for the next deal without selling this one.
- Cap rate 5.8% vs local median 2.3% in Salt Point — top-decile yield for the area; either an underpriced asset or a hidden risk that comps aren't pricing in. Stress-test before assuming the spread holds.
Questions for listing agent
- What do current leases actually rent for vs. the listed asking? Can we see a recent rent roll and the last 12 months of T-12 income?
- It's been on market 242 days. Have you received any prior offers? Is the seller open to a 17% concession, seller financing, or rate buy-down credit?
- Built in 1963 — when were the roof, HVAC, electrical panel, plumbing, and water heater last replaced?
- Why hasn't it sold? Are there any deal-killer items the seller is aware of (foundation, flood, title, zoning, code violations)?
- Is there a deadline driving the sale (1031 exchange, divorce, estate, relocation)? That informs how much negotiation room exists.
- Schools are F-rated, which usually means shorter tenancies and higher turnover. Who's the typical renter profile here, and what's been the actual vacancy rate?
- What's the average days-on-market for RENTAL listings here right now (not sales)? A rising rental-DOM trend means longer vacancies and softer asking-rent achievability than the comps imply.
- What's the recent tenant-quality profile in this submarket — average credit score on applications, eviction rate, late-payment / NSF rate, and stable-employment percentage? A property-management company in the area should have these aggregated.
CashFlowRE · CFR-BT1C5M6T05NTFF
· Data 3 weeks ago
cashflowre.app · 2026-05-29