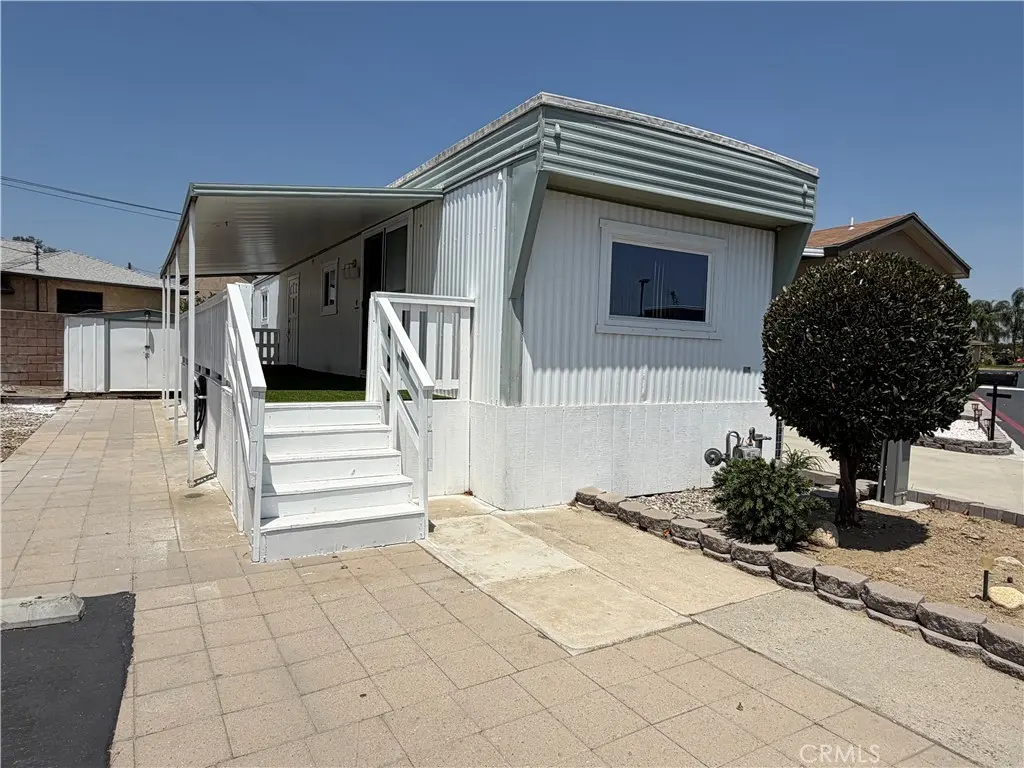
17455 Marygold Ave #5
Fontana, CA 92316
$79,999B+
2 bd · 1.0 ba ·
648 sqft ·
Built 1968
· Manufactured
· Active
· 22 DOM
Cashflow @ list (25.0% down · 7.5%)
Estimated rent
$1,724/mo
Mortgage (P&I)
−$420
Tax + insurance
−$133
HOA
−$0
Vac / Maint / Mgmt
−$362
Net cashflow
$809/mo
Annual
$9,708/yr
Cap rate
18.43%
Cash-on-cash
43.34%
DSCR
2.93
1% rule
2.15%
Cash to close
$22,400
Investor read
- This is a 2-bed/1.0-bath manufactured listed at $80k.
- At list price, monthly cash flow is $809 ($10k/yr) — positive.
- The deal already cash-flows at list — no discount required.
- Meets the 1% rule at list price ($2k rent vs $80k).
- It's been on market 22 days — a 2% lower offer ($79k) is reasonable based on typical stale-listing flexibility.
- Recommended offer: $79k (1.5% below list) — sets the bar for market timing.
- Local home prices are declining (-3.0%/yr); year-one equity from $553 of loan paydown is wiped out by about $2k of value loss. Plan a longer hold.
- Location reads 64/100 on livability (#415 in CA) — a middle-class / working-renter tenant base. Strengths: housing A+, commute A-, employment A-; Watch: schools F, amenities F, cost of living F.
- Colton Joint Unified (suburban): math 16% / reading 38% proficiency, ranked #373 of 517 in CA (top 72%) — low school quality limits family demand, transient renter base, plan for 1-2y turnover; 70% free/reduced lunch — lower-income household profile, screen leases tightly.
- Market conditions: 44 active listings in the ZIP; 4 comparable units currently listed for rent nearby; rentals lingering (median 44d on market — plan ~5-8 weeks vacancy on turnover, expect pricing pressure); 50% of comp listings sitting > 30 days — soft ceiling on asking rent; 5,458 units permitted in San Bernardino County in 2024 (1,500 in 5+ unit buildings).
- San Bernardino County population projected at +15% by 2050 — modest demand growth; plan on rents tracking national, not racing it.
- At projected returns (-3.0% appreciation + 3.0% rent growth), your $22k cash investment doubles in ~3 years — after that, you're playing with house money.
- Climate carrying-cost: extreme-heat days projected 7→18/yr by 2055 (HVAC capex compounding) — expect insurance premiums to compound above CPI over the hold.
- Cap rate 18.4% vs local median 3.2% in Fontana — top-decile yield for the area; either an underpriced asset or a hidden risk that comps aren't pricing in. Stress-test before assuming the spread holds.
Questions for listing agent
- Built in 1968 — when were the roof, HVAC, electrical panel, plumbing, and water heater last replaced?
- Is there a deadline driving the sale (1031 exchange, divorce, estate, relocation)? That informs how much negotiation room exists.
- Schools are F-rated, which usually means shorter tenancies and higher turnover. Who's the typical renter profile here, and what's been the actual vacancy rate?
- What's the average days-on-market for RENTAL listings here right now (not sales)? A rising rental-DOM trend means longer vacancies and softer asking-rent achievability than the comps imply.
- What's the recent tenant-quality profile in this submarket — average credit score on applications, eviction rate, late-payment / NSF rate, and stable-employment percentage? A property-management company in the area should have these aggregated.
- How much new for-sale + rental construction is in the pipeline within 1–3 miles? Heavy new supply typically softens prices + rents 12–24 months out; constrained supply supports both.
CashFlowRE · CFR-BTYRYX84PF5KE4
· Data 2 days ago
cashflowre.app · 2026-05-29