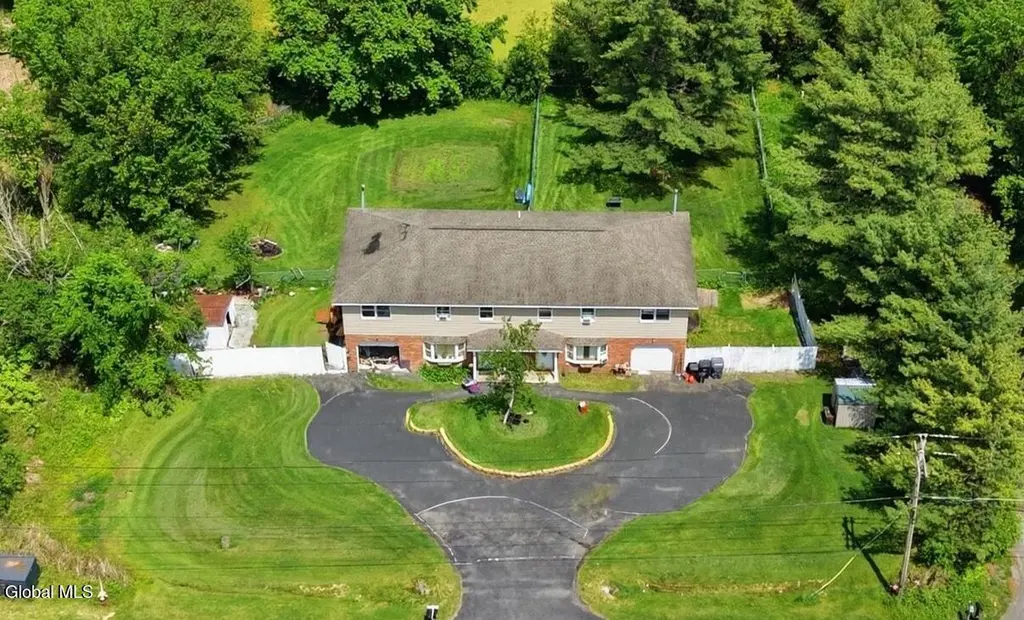
6190-6192 Depot Rd
Voorheesville, NY 12009
$500,000D-
6 bd · 3.0 ba ·
3,044 sqft ·
Built 1988
· MultiFamily
· Active
· 24 DOM
Cashflow @ list (25.0% down · 7.5%)
Estimated rent
$3,160/mo
Mortgage (P&I)
−$2,622
Tax + insurance
−$982
HOA
−$0
Vac / Maint / Mgmt
−$664
Net cashflow
$-1,108/mo
Annual
$-13,295/yr
Cap rate
3.63%
Cash-on-cash
-9.50%
DSCR
0.58
1% rule
0.63%
Cash to close
$140,000
Investor read
- This is a 2 × 3.0-bed/1.5-bath units multifamily listed at $500k.
- At list price, monthly cash flow is $-1k ($-13k/yr) — negative. Per door: $-554/mo.
- To cash-flow at today's rent, offer at most $304k (39.1% below list).
- To meet the 1% rule (rent ≥ 1% of price), the offer needs to be $316k (36.8% below list).
- It's been on market 24 days — a 2% lower offer ($492k) is reasonable based on typical stale-listing flexibility.
- Recommended offer: $304k (39.1% below list) — sets the bar for cash-flow.
- In year one you build about $53k of equity ($3k loan paydown + $50k appreciation (10.0% local appreciation)).
- Location reads 72/100 on livability (#369 in NY) — a middle-class / working-renter tenant base. Strengths: crime A+, employment A+, housing A+; Watch: cost of living D, amenities F, commute F.
- Guilderland Central School District (suburban): math 61% / reading 68% proficiency, ranked #166 of 590 in NY (top 28%) — acceptable for families but not a draw, mixed tenant base, ~2y average lease; only 10% free/reduced lunch — higher-income household profile.
- Zoned schools: Altamont Elementary School (math 62% / reading 57%, grade B-, #745 of 2,108 statewide, top 39%, 310 students, 25% FRL); Farnsworth Middle School (math 42% / reading 68%, grade B-, #212 of 729 statewide, top 29%, 1,151 students, 24% FRL); Guilderland High School (math 97% / reading 82%, grade A+, #265 of 1,100 statewide, top 26%, 1,462 students, 23% FRL).
- Market conditions: 48 active listings in the ZIP; 675 units permitted in Albany County in 2024 (451 in 5+ unit buildings).
- Albany County population projected at +9% by 2050 — modest demand growth; plan on rents tracking national, not racing it.
- By year 2, paydown + projected appreciation supports a ~$86k cash-out refi (75% LTV) — recoverable capital for the next deal without selling this one.
- Cap rate 3.6% vs local median 1.7% in Voorheesville — top-decile yield for the area; either an underpriced asset or a hidden risk that comps aren't pricing in. Stress-test before assuming the spread holds.
Questions for listing agent
- What do current leases actually rent for vs. the listed asking? Can we see a recent rent roll and the last 12 months of T-12 income?
- Can we see the unit-by-unit rent roll, current vacancy, and any below-market leases? What's the average tenancy length?
- What capital expenditures (roof, boiler, parking lot, exteriors) have been made in the last 5 years, and what's planned in the next 2?
- Is there a deadline driving the sale (1031 exchange, divorce, estate, relocation)? That informs how much negotiation room exists.
- Schools are A-rated — typically a magnet for longer-tenancy family renters. What's the average tenant stay here, and is there a school-zone premium baked into asking?
- The area grade is low — what's the realistic commute time and amenity access for the typical tenant pool here? Any planned neighborhood developments (good or bad) we should know about?
- What's the average days-on-market for RENTAL listings here right now (not sales)? A rising rental-DOM trend means longer vacancies and softer asking-rent achievability than the comps imply.
- What's the recent tenant-quality profile in this submarket — average credit score on applications, eviction rate, late-payment / NSF rate, and stable-employment percentage? A property-management company in the area should have these aggregated.
CashFlowRE · CFR-BVGSPME94BRV2F
· Data 22 h ago
cashflowre.app · 2026-05-29