 Duplex
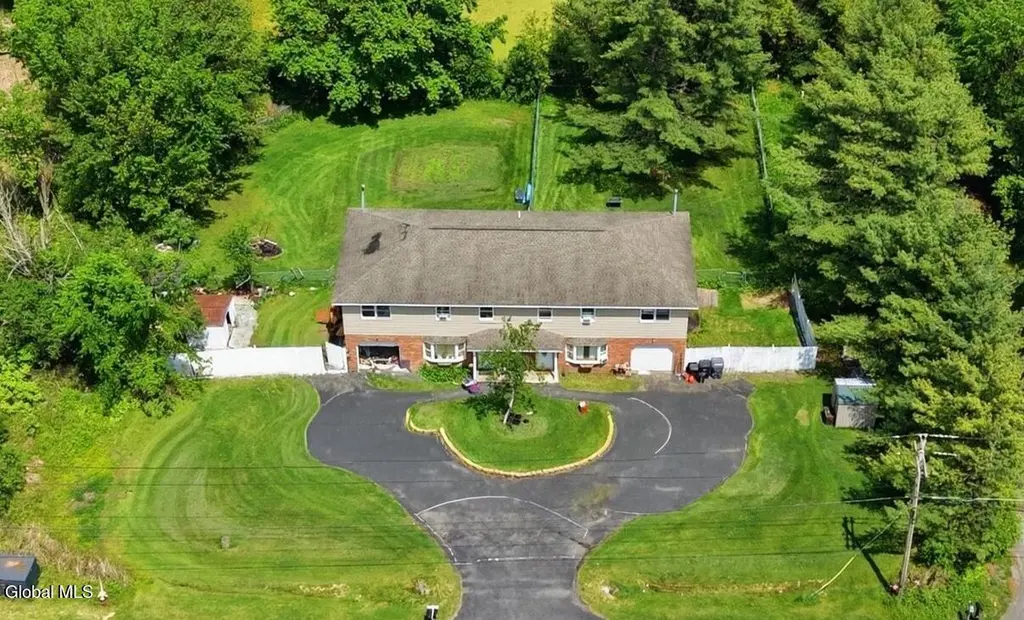
6190-6192 Depot Rd · Voorheesville, NY
Flood risk 1/10 · Minimal
- FEMA flood zone
- X (unshaded)
- Chance of flooding over 30 yrs
- 0.0%
- Est. flood insurance / yr
- $473 – $860
Fire risk 2/10 · Minimal
- Est. fire insurance / yr
- $691 – $1,283
Heat risk 3/10 · Minor
- Hot days now (above 97°F)
- 7 days/yr
- Hot days in 30 yrs
- 16 days/yr
Wind risk 3/10 · Minor
- Chance of severe wind over 30 yrs
- 6.0%
Air-quality risk 1/10 · Minimal
- Unhealthy air days now
- 0 days/yr
- Unhealthy air days in 30 yrs
- 0 days/yr
Risk factors via First Street. Map © Google.
Why this score? — see what drove the D- grade
The composite is a weighted blend of 9 inputs, each scored 0–100. Each bar is that input's sub-score; the figure is the points it added to the 100-point composite (weight × sub-score).
- Appreciation +10.0/10.0
- ARV discount +7.5/15.0
- Schools +5.7/10.0
- Cash flow +5.3/30.0
- Livability +3.6/5.0
- Rent growth +2.5/5.0
- Condition / age +2.5/5.0
- 1% rule +1.3/10.0
- DSCR +0.0/10.0
$500,000
🖨 Deal sheet (PDF) 📄 Offer letter ✓ Due diligence
Multi-family units
County records classify this as Multi-Family (2-4 Unit). Listing-text estimate: 2 units. confirmed
Listing remarks
* * * OPEN HOUSE 6/20/26 12pm - 2pm * * * Two side-by-side units, one smart investment. This well-configured side-by-side duplex on 0.52 acres offers a compelling income opportunity in one of Albany County's most desirable small communities. Currently owner-occupied, both units are being sold as is and present a cosmetic update opportunity for the buyer looking to add value and maximize returns. Each unit mirrors the other in layout -- 3 bedrooms, 1.5 baths, a full kitchen, living room, first floor laundry, a private 1-car garage, large deck, and a fenced yard. Utilities are completely separate, simplifying management and maximizing flexibility for the next owner. At 3,044 total sq ft
Key facts
- Large deck
- Separate utilities
- Fenced yard
Tags
Property features AI
Finance
- Financial info: Property is a 2-unit multifamily (duplex)
Exterior
- Parking: Attached 2-car garage (total 2 parking spaces)
- Utilities: Public water; Public sewer
- Home design: Duplex; 2-story units
- Construction: Vinyl siding; Asphalt roof
- Exterior features: Deck; Fenced yard
Interior
- Kitchen: Each unit includes a kitchen on the 1st floor
- Bedrooms: Each unit has 3 bedrooms (bedrooms for each unit are on the 2nd floor)
- Flooring: Carpet; Hardwood
- Bathrooms: Each unit has 1 full bath and 1 half bath (full and half baths are split between 1st and 2nd floors)
- Heating & cooling: Natural gas heating
- Interior features: Carpet and hardwood flooring
- Laundry & utility: Main-level laundry
Neighborhood map
What this means for you Summary
Snapshot
- This is a 2 × 3.0-bed/1.5-bath units multifamily listed at $500k.
Deal economics
- At list price, monthly cash flow is $-1k ($-13k/yr) — negative. Per door: $-554/mo.
- To cash-flow at today's rent, offer at most $304k (39.1% below list).
- To meet the 1% rule (rent ≥ 1% of price), the offer needs to be $316k (36.8% below list).
- Recommended offer: $304k (39.1% below list) — sets the bar for cash-flow.
- Cap rate 3.6% vs local median 1.7% in Voorheesville — top-decile yield for the area; either an underpriced asset or a hidden risk that comps aren't pricing in. Stress-test before assuming the spread holds.
Location & tenants
- Location reads 72/100 on livability (#369 in NY) — a middle-class / working-renter tenant base. Strengths: crime A+, employment A+, housing A+; Watch: cost of living D, amenities F, commute F.
- Guilderland Central School District (suburban): math 61% / reading 68% proficiency, ranked #166 of 590 in NY (top 28%) — acceptable for families but not a draw, mixed tenant base, ~2y average lease; only 10% free/reduced lunch — higher-income household profile.
- Zoned schools: Altamont Elementary School (math 62% / reading 57%, grade B-, #745 of 2,108 statewide, top 39%, 310 students, 25% FRL); Farnsworth Middle School (math 42% / reading 68%, grade B-, #212 of 729 statewide, top 29%, 1,151 students, 24% FRL); Guilderland High School (math 97% / reading 82%, grade A+, #265 of 1,100 statewide, top 26%, 1,462 students, 23% FRL).
- Market conditions: 48 active listings in the ZIP; 675 units permitted in Albany County in 2024 (451 in 5+ unit buildings).
Forward outlook
- In year one you build about $53k of equity ($3k loan paydown + $50k appreciation (10.0% local appreciation)).
- Albany County population projected at +9% by 2050 — modest demand growth; plan on rents tracking national, not racing it.
- By year 2, paydown + projected appreciation supports a ~$86k cash-out refi (75% LTV) — recoverable capital for the next deal without selling this one.
Negotiation context
- It's been on market 24 days — a 2% lower offer ($492k) is reasonable based on typical stale-listing flexibility.
Questions for the listing agent
- What do current leases actually rent for vs. the listed asking? Can we see a recent rent roll and the last 12 months of T-12 income?
- Can we see the unit-by-unit rent roll, current vacancy, and any below-market leases? What's the average tenancy length?
- What capital expenditures (roof, boiler, parking lot, exteriors) have been made in the last 5 years, and what's planned in the next 2?
- Is there a deadline driving the sale (1031 exchange, divorce, estate, relocation)? That informs how much negotiation room exists.
- Schools are A-rated — typically a magnet for longer-tenancy family renters. What's the average tenant stay here, and is there a school-zone premium baked into asking?
- The area grade is low — what's the realistic commute time and amenity access for the typical tenant pool here? Any planned neighborhood developments (good or bad) we should know about?
- What's the average days-on-market for RENTAL listings here right now (not sales)? A rising rental-DOM trend means longer vacancies and softer asking-rent achievability than the comps imply.
- What's the recent tenant-quality profile in this submarket — average credit score on applications, eviction rate, late-payment / NSF rate, and stable-employment percentage? A property-management company in the area should have these aggregated.
- How much new apartment / multifamily construction is in the pipeline within 1–3 miles? Heavy new supply (>2% of stock underway) typically softens rents 12–24 months out; light construction supports rent growth.
Investment metrics
- 1% rule
- 0.63% ✗
- Cap rate
- 3.63%
- Cash-on-cash
- -9.50%
- DSCR
- 0.58
- GRM
- 13.2
CMA / ARV
No comps found within radius.
Projected returns pro-forma
10.0% appreciation · 3.0% rent growth · sell at horizon
- IRR
- 17.6%
- Equity multiple
- 2.44×
- Total profit
- $201,889
- Equity at exit
- $450,440
- IRR
- 16.6%
- Equity multiple
- 5.64×
- Total profit
- $650,298
- Equity at exit
- $971,390
Cash invested: $140,000 (down + closing). Projections, not guarantees.
Landlord ↔ Tenant lean methodology
- Overall (STATE)
- 15 Strongly Tenant-Friendly
- State New York
- 15 Strongly Tenant-Friendly · D+10
- County
- — inherits STATE
- City
- — inherits STATE
ZIP-level market 12009
- Home prices YoY
- 7.0%
- Active inventory
- 48
- Price-to-rent
- 26.4×
Monthly cashflow live
- Estimated rent
- $3,160 medium interval (Pro) →
- Mortgage (P&I)
- −$2,622
- Tax from tax record
- −$774 /mo · $9,287/yr
- Insurance
- −$208
- HOA
- −$0
- Vacancy / Maint / Mgmt
- −$664
- Net cashflow
- $-1,108
Break-even live
Sensitivity live
| Price | -10% $-825 | -5% $-966 | +0% $-1,108 | +5% $-1,249 | +10% $-1,391 |
|---|---|---|---|---|---|
| Rent | -10% $-1,358 | -5% $-1,233 | +0% $-1,108 | +5% $-983 | +10% $-858 |
| Rate | -1.0pp $-856 | -0.5pp $-981 | base $-1,108 | +0.5pp $-1,237 | +1.0pp $-1,369 |
2-unit breakdown (identical units grouped — click to expand)
| Units | Beds | Baths | Est. rent |
|---|---|---|---|
| 2× units | 3.0 | 1.5 | $3,160 |
| #1 | 3.0 | 1.5 | $1,580 |
| #2 | 3.0 | 1.5 | $1,580 |
| Total (2 units) | $3,160 | ||
UW: 25.0% down · 7.5% · 30yr · 1.5% tax · 5.0% vac · 8.0% maint · 8.0% mgmt
Financing live
Cash to close
- Down payment
- $125,000
- Closing costs
- $15,000
- Reserves months
- —
- Total cash needed
- —
Loan-product check · same deal, 3 products live
Conventional
25% down · 7.5% · 30yr
- Down + closing
- —
- Monthly P&I
- —
- Monthly cashflow
- —
- DSCR
- —
- Eligible?
- —
Personal DTI + credit; lowest rate.
DSCR
20% down · 8.5% · 30yr
- Down + closing
- —
- Monthly P&I
- —
- Monthly cashflow
- —
- DSCR
- —
- Eligible?
- —
No personal income docs; deal must DSCR.
Hard money
10% down · 12.0% · 12mo
- Down + closing
- —
- Monthly P&I
- —
- Monthly cashflow
- —
- DSCR
- —
- Eligible?
- —
Short-term bridge; refi at stabilization.
Listing history 18 events
-
2026-06-21days on market $500,000 Active 24 DOM
-
2026-06-19price $500,000 Active 21 DOM
-
2026-06-18days on market $530,000 Active 21 DOM
-
2026-06-17days on market $530,000 Active 20 DOM
-
2026-06-16days on market $530,000 Active 19 DOM
-
2026-06-15days on market $530,000 Active 18 DOM
-
2026-06-14days on market $530,000 Active 16 DOM
-
2026-06-10days on market $530,000 Active 13 DOM
-
2026-06-09days on market $530,000 Active 12 DOM
-
2026-06-08days on market $530,000 Active 11 DOM
-
2026-06-07days on market $530,000 Active 10 DOM
-
2026-06-05days on market $530,000 Active 7 DOM
-
2026-06-03days on market $530,000 Active 6 DOM
-
2026-06-02days on market $530,000 Active 5 DOM
-
2026-06-01days on market $530,000 Active 4 DOM
-
2026-05-31days on market $530,000 Active 3 DOM
-
2026-05-31days on market $530,000 Active 2 DOM
-
2026-05-28$530,000 Active
ⓘ Source: listings_history table (triggers on properties + properties_extension) + one-shot
backfill from property_details.listing_events for pre-trigger history.
Tax reassessment forecast NY · Partial reset (capped growth)
- Current annual tax
- $9,287 · $774/mo
- Projected year-2 tax
- $9,287 · $774/mo
- Expected delta
- $0/yr ($0/mo · 0.0%)
ⓘ Screening estimate from a state-policy table — verify with the county assessor before closing.
Climate risk First Street
- Flood 1/10 Low FEMA zone X (unshaded) · 0% chance over 30 yrs
- Wildfire 2/10 Low
- Heat 3/10 Moderate 7 d/yr ≥97°F today · 16 d/yr by 30 yrs out
- Wind 3/10 Moderate 6% chance of damaging wind over 30 yrs
- Air quality 1/10 Low 0 unhealthy d/yr today · 0 by 30 yrs out
Nearby sold comps map
Loading sold comps map…
Walkable amenities ~0.75 mi
Loading nearby amenities…
Taxation est. · year 1
- Rental income
- $37,920
- − Mortgage interest
- −$28,008
- − Property taxes
- −$9,287
- − Insurance
- −$2,500
- − Repairs & maintenance
- −$3,034
- − Management
- −$3,034
- − Depreciation
- −$14,545
- Taxable loss
- −$22,487
- Est. tax savings @ 24.0%
- +$5,397
- After-tax cash flow
- $-7,898/yr
For passive investors: Depreciation is non-cash, so a rental often shows a tax loss while cash-flowing — sheltering income. Rental losses are passive: they offset passive income freely, and up to $25,000/yr can offset ordinary (W-2) income if you actively participate and your MAGI is under $100k (phasing out to $0 by $150k); unused losses carry forward. On sale, claimed depreciation is recaptured at up to 25%, and gains may owe capital-gains tax (a 1031 exchange can defer both). Figures are a year-1 estimate at your 24.0% rate — not tax advice; consult a CPA.
Schools (NCES district)
- District
- Guilderland Central School District
- NCES district ID
- 3613080
- Math proficiency
- 61% ▼ -8.00%
- Reading proficiency
- 68% ▲ 5.00%
- Median HH income
- $75,669
- Composite
- 57.24/100
- National rank
- #1093
- State rank
- #166 of 590 in NY
Livability — Voorheesville
- Score
- 72/100
- State rank
- #369
- US rank
- #6390
Category grades
Schools grade is shown separately in the Schools card above.
Census & demographics
- Population (ZIP)
- 8,068
Population outlook (Albany County) Hauer SSP2
- Today (2025)
- 320,794 people
- By 2030
- 327,401 · +2.1%
- By 2040
- 338,218 · +5.4%
- By 2050
- 348,467 · +8.6%
- By 2075
- 381,693 · +19.0%
- By 2100
- 393,809 · +22.8%
Race, ethnicity, and origin ACS 2023
- Neighborhood character
- Predominantly White (83%)
- Race & ethnicity
- White 83% Asian 7% Two or more races 5% Hispanic / Latino 3% Black 3%
- Common ancestry
- Romanian 8% Iranian 4% Lithuanian 4%
- Foreign-born
- 7% · Canada, China, South Korea
- Languages at home
- 92% English-only · Spanish 2% Other Asian/Pacific 2% Korean 1%
Political lean MEDSL · Albany
- 2024 margin
- Strong D (+25.8) · D 62.9% · R 37.1%
- 2008→2024 swing
- -3.6pp toward R · 2008: 29.4pp · 2024: 25.8pp
- All cycles
- 2024: D+25.8 2020: D+31.4 2016: D+24.3 2012: D+31.0 2008: D+29.4
Not yet ingested
- Civics
- —
Market trends
- HPI YoY
- ▲ 18.85%
- Current HPI
- 290.1144
- Rent YoY
- —
- Metro
- —
- State GDP YoY
- ▲ 2.60%
- F500 in state
- 92
Industry mix (Fortune 500 HQ in NY)
| Industry | F500 HQs | Revenue |
|---|---|---|
| Financial Services | 10 | $950B |
|
||
| Consumer Goods | 9 | $162B |
|
||
| Insurance | 4 | $225B |
|
||
| Telecommunications | 2 | $144B |
|
||
| Pharmaceuticals | 2 | $112B |
|
||
| Media / Entertainment | 2 | $69B |
|
||
Price history
1 event — show timeline
- 2026-05-28 Listed $530,000 Global MLS
Property tax history
+1.7%/yrLatest (2025): $9,287 · -6.1% YoY. Source: county tax records.
Cash-flow waterfall
monthlySold comps — $/sqft
last 12 mo · ≤1 miLoading sold comps…