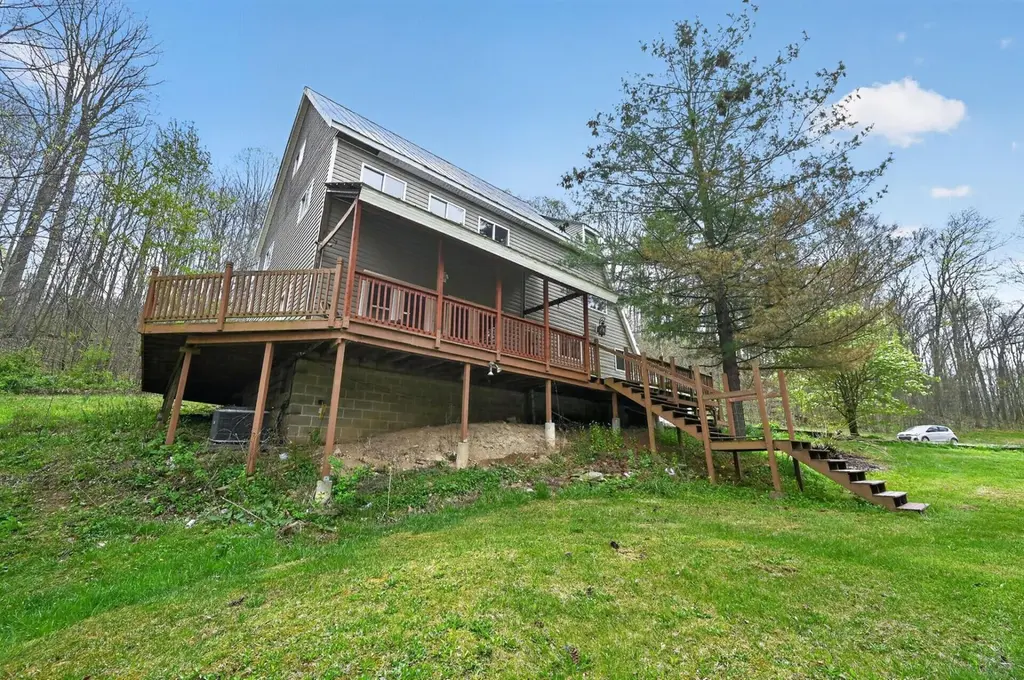
3890 Auerville Rd
Bainbridge, OH 45612
$219,000F
4 bd · 2.0 ba ·
2,970 sqft ·
Built 2005
· SingleFamily
· Active
· 25 DOM
Cashflow @ list (25.0% down · 7.5%)
Estimated rent
$1,314/mo
Mortgage (P&I)
−$1,148
Tax + insurance
−$316
HOA
−$0
Vac / Maint / Mgmt
−$276
Net cashflow
$-426/mo
Annual
$-5,114/yr
Cap rate
3.96%
Cash-on-cash
-8.34%
DSCR
0.63
1% rule
0.60%
Cash to close
$61,320
Investor read
- This is a 4-bed/2.0-bath single-family listed at $219k.
- At list price, monthly cash flow is $-426 ($-5k/yr) — negative.
- To cash-flow at today's rent, offer at most $144k (34.4% below list).
- To meet the 1% rule (rent ≥ 1% of price), the offer needs to be $131k (40.0% below list).
- It's been on market 25 days — a 2% lower offer ($216k) is reasonable based on typical stale-listing flexibility.
- Recommended offer: $131k (40.0% below list) — sets the bar for 1% rule.
- In year one you build about $4k of equity ($2k loan paydown + $3k appreciation (1.3% local appreciation)).
- Location reads 68/100 on livability (#546 in OH) — a middle-class / working-renter tenant base. Strengths: crime A+, employment A+, housing A+; Watch: amenities F, commute F, cost of living F.
- Western Local (rural): math 29% / reading 40% proficiency, ranked #567 of 656 in OH (top 86%) — families likely to look elsewhere, expect single-tenant / working-renter base with shorter leases; 64% free/reduced lunch — lower-income household profile, screen leases tightly.
- Market conditions: 23 active listings in the ZIP; 45 units permitted in Pike County in 2024 (0 in 5+ unit buildings).
- Pike County population projected at -21% by 2050 — secular population decline; favor cash flow + early exit over multi-decade hold.
- 2 sale attempts since 7y ago; this cycle's ask has dropped $21k (9%) from the opening price — seller is motivated, your offer sets the floor, not the list.
- Current owner paid $160k; 37% above their basis — modest negotiation headroom, anchor on the comps not their cost.
- By year 8, paydown + projected appreciation supports a ~$34k cash-out refi (75% LTV) — recoverable capital for the next deal without selling this one.
- Cap rate 4.0% vs local median 2.1% in Bainbridge — top-decile yield for the area; either an underpriced asset or a hidden risk that comps aren't pricing in. Stress-test before assuming the spread holds.
- This rent runs 31% of the median local income ($50k/yr) — at the standard rent-burdened threshold; future hikes will face affordability resistance.
Questions for listing agent
- What do current leases actually rent for vs. the listed asking? Can we see a recent rent roll and the last 12 months of T-12 income?
- Is there a deadline driving the sale (1031 exchange, divorce, estate, relocation)? That informs how much negotiation room exists.
- Schools are B-rated — typically a magnet for longer-tenancy family renters. What's the average tenant stay here, and is there a school-zone premium baked into asking?
- The area grade is low — what's the realistic commute time and amenity access for the typical tenant pool here? Any planned neighborhood developments (good or bad) we should know about?
- What's the average days-on-market for RENTAL listings here right now (not sales)? A rising rental-DOM trend means longer vacancies and softer asking-rent achievability than the comps imply.
- What's the recent tenant-quality profile in this submarket — average credit score on applications, eviction rate, late-payment / NSF rate, and stable-employment percentage? A property-management company in the area should have these aggregated.
- How much new for-sale + rental construction is in the pipeline within 1–3 miles? Heavy new supply typically softens prices + rents 12–24 months out; constrained supply supports both.
CashFlowRE · CFR-BW8AJFCR9JGS2R
· Data 2 weeks ago
cashflowre.app · 2026-05-29