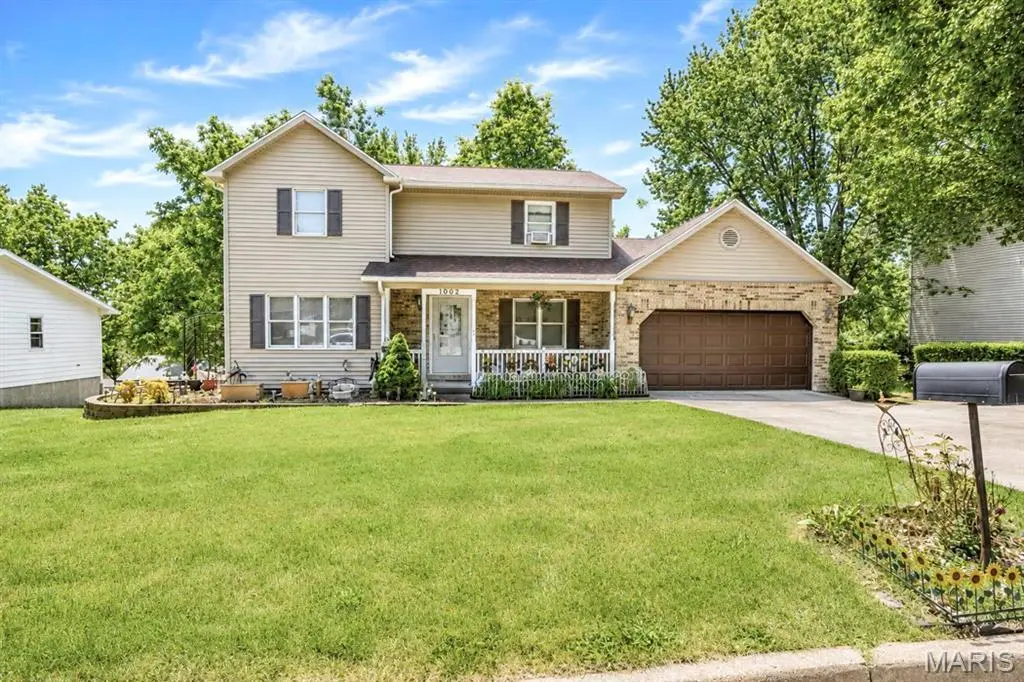
1002 Pheasant Hill Dr
Rolla, MO 65401
$245,000D
3 bd · 1.0 ba ·
1,776 sqft ·
Built 1992
· SingleFamily
· Pending
· 7 DOM
Cashflow @ list (25.0% down · 7.5%)
Estimated rent
$1,559/mo
Mortgage (P&I)
−$1,285
Tax + insurance
−$256
HOA
−$0
Vac / Maint / Mgmt
−$327
Net cashflow
$-310/mo
Annual
$-3,716/yr
Cap rate
4.78%
Cash-on-cash
-5.42%
DSCR
0.76
1% rule
0.64%
Cash to close
$68,600
Investor read
- This is a 3-bed/1.0-bath single-family listed at $245k.
- At list price, monthly cash flow is $-310 ($-4k/yr) — negative.
- To cash-flow at today's rent, offer at most $190k (22.3% below list).
- To meet the 1% rule (rent ≥ 1% of price), the offer needs to be $156k (36.4% below list).
- Only 7 days on market — expect competitive offers; lowballing is unlikely to land.
- Recommended offer: $156k (36.4% below list) — sets the bar for 1% rule.
- Local home prices are declining (-3.0%/yr); year-one equity from $2k of loan paydown is wiped out by about $7k of value loss. Plan a longer hold.
- Location reads 73/100 on livability (#76 in MO) — a middle-class / working-renter tenant base. Strengths: cost of living A+, health & safety A+, housing A-; Watch: crime D, commute F, employment D-.
- Rolla 31 (town): math 38% / reading 48% proficiency, ranked #118 of 324 in MO (top 36%) — families likely to look elsewhere, expect single-tenant / working-renter base with shorter leases.
- Zoned schools: Harry S. Truman Elem. (math 42% / reading 47%, grade F, #413 of 1,115 statewide, top 42%, 431 students, 51% FRL); Rolla Sr. High (math 25% / reading 61%, grade F, #211 of 521 statewide, top 41%, 1,323 students, 34% FRL) — zoned schools at 42% FRL track the district average.
- Market conditions: Rents rising fast (+10.2%/yr); 268 active listings in the ZIP; 2 comparable units currently listed for rent nearby; 162 units permitted in Phelps County in 2024 (83 in 5+ unit buildings).
- Phelps County population projected at -12% by 2050 — secular population decline; favor cash flow + early exit over multi-decade hold.
- Climate carrying-cost: extreme-heat days projected 7→19/yr by 2055 (HVAC capex compounding) — expect insurance premiums to compound above CPI over the hold.
- Cap rate 4.8% vs local median 3.5% in Rolla — top-decile yield for the area; either an underpriced asset or a hidden risk that comps aren't pricing in. Stress-test before assuming the spread holds.
- This rent runs 33% of the median local income ($56k/yr) — at the standard rent-burdened threshold; future hikes will face affordability resistance.
Questions for listing agent
- What do current leases actually rent for vs. the listed asking? Can we see a recent rent roll and the last 12 months of T-12 income?
- Is there a deadline driving the sale (1031 exchange, divorce, estate, relocation)? That informs how much negotiation room exists.
- Schools are B-rated — typically a magnet for longer-tenancy family renters. What's the average tenant stay here, and is there a school-zone premium baked into asking?
- Crime grade is D in this area — have there been break-ins, vandalism, or insurance claims at this property in the last 3 years? What carrier currently insures it and at what premium?
- The area grade is low — what's the realistic commute time and amenity access for the typical tenant pool here? Any planned neighborhood developments (good or bad) we should know about?
- What's the average days-on-market for RENTAL listings here right now (not sales)? A rising rental-DOM trend means longer vacancies and softer asking-rent achievability than the comps imply.
- What's the recent tenant-quality profile in this submarket — average credit score on applications, eviction rate, late-payment / NSF rate, and stable-employment percentage? A property-management company in the area should have these aggregated.
- How much new for-sale + rental construction is in the pipeline within 1–3 miles? Heavy new supply typically softens prices + rents 12–24 months out; constrained supply supports both.
CashFlowRE · CFR-BYS3GA6DV5RH0X
· Data 3 weeks ago
cashflowre.app · 2026-05-29