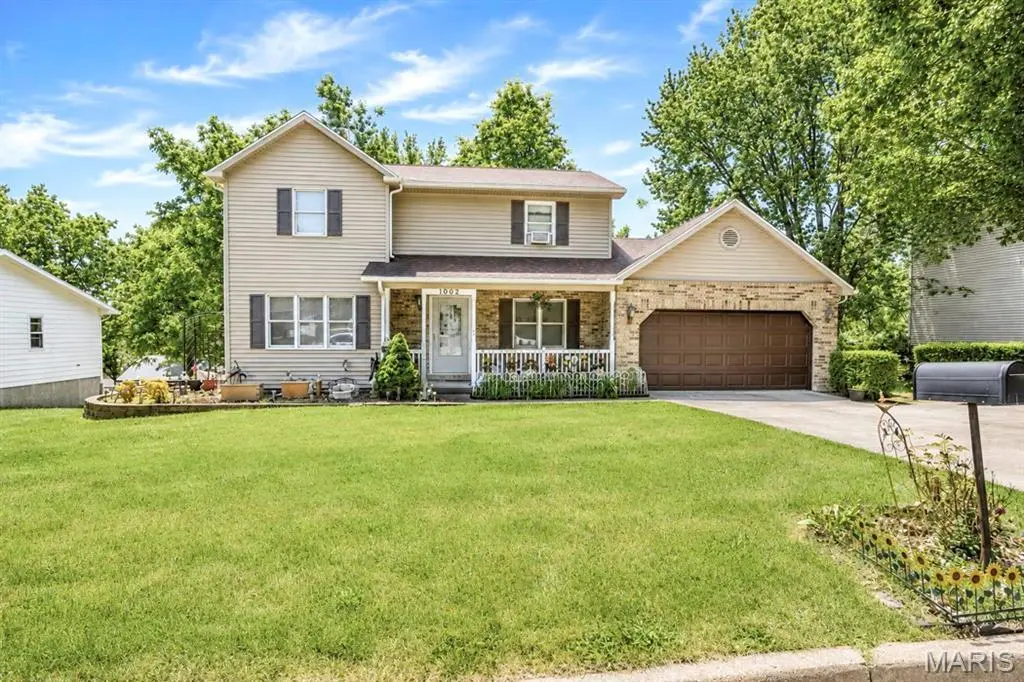
1002 Pheasant Hill Dr · Rolla, MO
Flood risk 1/10 · Minimal
- FEMA flood zone
- X (unshaded)
- Chance of flooding over 30 yrs
- 0.0%
- Est. flood insurance / yr
- $473 – $860
Fire risk 3/10 · Minor
- Est. fire insurance / yr
- $1,054 – $1,958
Heat risk 5/10 · Moderate
- Hot days now (above 106°F)
- 7 days/yr
- Hot days in 30 yrs
- 19 days/yr
Wind risk 2/10 · Minimal
- Chance of severe wind over 30 yrs
- —
Air-quality risk 2/10 · Minimal
- Unhealthy air days now
- 0 days/yr
- Unhealthy air days in 30 yrs
- 1 days/yr
Risk factors via First Street. Map © Google.
Why this score? — see what drove the D grade
The composite is a weighted blend of 9 inputs, each scored 0–100. Each bar is that input's sub-score; the figure is the points it added to the 100-point composite (weight × sub-score).
- ARV discount +15.0/15.0
- Cash flow +7.5/30.0
- Rent growth +5.0/5.0
- Livability +3.7/5.0
- Schools +3.6/10.0
- Condition / age +2.5/5.0
- DSCR +1.6/10.0
- 1% rule +1.4/10.0
- Appreciation +0.0/10.0
$245,000
🖨 Deal sheet 📄 Offer letter ✓ Due diligence
Listing remarks
Charming 3-bedroom, 2.5-bath two-story home located in a well-established neighborhood convenient to parks, schools, shopping, dining, and more! Enjoy relaxing on the cozy covered front porch before stepping inside to a functional floor plan featuring the kitchen, living room, dining room, laundry room, and half bath on the main level. Upstairs offers 3 bedrooms and 2 full baths, including the primary suite. The full walk-out basement includes an additional full bathroom with approximately one-third unfinished, offering great storage or future expansion potential. Complete with a 2-car garage, this home offers comfort, convenience, and room to grow! Metal shed included.
Key facts
- Covered front porch
- Great storage
- Metal shed
Tags
Property features AI
Finance
- Financial info: Lease not considered
Exterior
- Parking: Driveway; Attached garage with 2 spaces
- Utilities: Public water; Public sewer; Electricity connected (220 volts)
- Home design: Single-family residence; Two levels; Private ownership; House structure
- Construction: Brick and vinyl siding construction; Shingle roof
- Exterior features: Covered patio/porch; Deck; Front porch; Back yard; Front yard; Chain-link fencing in back yard; Sliding doors; Storm doors; City street frontage
Interior
- Kitchen: Electric cooktop; Built-in electric oven; Dishwasher; Refrigerator
- Bedrooms: 3 bedrooms on the main level
- Flooring: Carpet; Hardwood; Vinyl
- Bathrooms: 3 full bathrooms; 1 half bathroom (main level)
- Heating & cooling: Electric forced-air heating; Central air conditioning
- Interior features: Eat-in kitchen; Partially finished basement with walk-out access and storage; Full bathroom in basement; 9+ ft poured basement
- Laundry & utility: Main-level laundry
Neighborhood map
What this means for you Summary
Snapshot
- This is a 3-bed/1.0-bath single-family listed at $245k.
Deal economics
- At list price, monthly cash flow is $-310 ($-4k/yr) — negative.
- To cash-flow at today's rent, offer at most $190k (22.3% below list).
- To meet the 1% rule (rent ≥ 1% of price), the offer needs to be $156k (36.4% below list).
- Recommended offer: $156k (36.4% below list) — sets the bar for 1% rule.
- Cap rate 4.8% vs local median 3.5% in Rolla — top-decile yield for the area; either an underpriced asset or a hidden risk that comps aren't pricing in. Stress-test before assuming the spread holds.
Location & tenants
- Location reads 73/100 on livability (#76 in MO) — a middle-class / working-renter tenant base. Strengths: cost of living A+, health & safety A+, housing A-; Watch: crime D, commute F, employment D-.
- Rolla 31 (town): math 38% / reading 48% proficiency, ranked #118 of 324 in MO (top 36%) — families likely to look elsewhere, expect single-tenant / working-renter base with shorter leases.
- Zoned schools: Harry S. Truman Elem. (math 42% / reading 47%, grade F, #413 of 1,115 statewide, top 42%, 431 students, 51% FRL); Rolla Sr. High (math 25% / reading 61%, grade F, #211 of 521 statewide, top 41%, 1,323 students, 34% FRL) — zoned schools at 42% FRL track the district average.
- Market conditions: Rents rising fast (+10.2%/yr); 268 active listings in the ZIP; 2 comparable units currently listed for rent nearby; 162 units permitted in Phelps County in 2024 (83 in 5+ unit buildings).
- This rent runs 33% of the median local income ($56k/yr) — at the standard rent-burdened threshold; future hikes will face affordability resistance.
Forward outlook
- Local home prices are declining (-3.0%/yr); year-one equity from $2k of loan paydown is wiped out by about $7k of value loss. Plan a longer hold.
- Phelps County population projected at -12% by 2050 — secular population decline; favor cash flow + early exit over multi-decade hold.
Negotiation context
- Only 7 days on market — expect competitive offers; lowballing is unlikely to land.
Risks & watch-outs
- Climate carrying-cost: extreme-heat days projected 7→19/yr by 2055 (HVAC capex compounding) — expect insurance premiums to compound above CPI over the hold.
Questions for the listing agent
- What do current leases actually rent for vs. the listed asking? Can we see a recent rent roll and the last 12 months of T-12 income?
- Is there a deadline driving the sale (1031 exchange, divorce, estate, relocation)? That informs how much negotiation room exists.
- Schools are B-rated — typically a magnet for longer-tenancy family renters. What's the average tenant stay here, and is there a school-zone premium baked into asking?
- Crime grade is D in this area — have there been break-ins, vandalism, or insurance claims at this property in the last 3 years? What carrier currently insures it and at what premium?
- The area grade is low — what's the realistic commute time and amenity access for the typical tenant pool here? Any planned neighborhood developments (good or bad) we should know about?
- What's the average days-on-market for RENTAL listings here right now (not sales)? A rising rental-DOM trend means longer vacancies and softer asking-rent achievability than the comps imply.
- What's the recent tenant-quality profile in this submarket — average credit score on applications, eviction rate, late-payment / NSF rate, and stable-employment percentage? A property-management company in the area should have these aggregated.
- How much new for-sale + rental construction is in the pipeline within 1–3 miles? Heavy new supply typically softens prices + rents 12–24 months out; constrained supply supports both.
Investment metrics
- 1% rule
- 0.64% ✗
- Cap rate
- 4.78%
- Cash-on-cash
- -5.42%
- DSCR
- 0.76
- GRM
- 13.1
CMA / ARV
- ARV (median comp)
- $304,154
- List price
- $245,000
- Delta
- -19.45%
- Verdict
- UNDERPRICED
- Comps
- 20 within 1.0 mi
Show comp detail 12 sales within ~0.75 mi
| Address | Dist | Beds/Ba | Sqft | Sold | Price | $/sf | Match |
|---|---|---|---|---|---|---|---|
| 708 Chestnut Dr | 0.27mi | 3/2.0 | 1,754 (-1%) | 10mo | $258,900 | $148 | 73 |
| 589 Sycamore Dr | 0.19mi | 3/2.0 | 1,913 (+8%) | 7mo | $325,000 | $170 | 68 |
| 1204 Sycamore Dr | 0.22mi | 3/2.0 | 1,658 (-7%) | 10mo | $239,900 | $145 | 67 |
| 1508 Overland Dr | 0.63mi | 3/2.0 | 1,756 (-1%) | 4mo | $300,000 | $171 | 61 |
| 1415 Overland Dr | 0.50mi | 4/3.0 (+1) | 1,809 (+2%) | 1mo | $314,900 | $174 | 60 |
| 1308 Sycamore Dr | 0.30mi | 3/2.0 | 1,960 (+10%) | 7mo | $319,900 | $163 | 59 |
| 1221 Casey Ln | 0.74mi | 3/2.0 | 1,760 (-1%) | 3mo | $299,900 | $170 | 58 |
| 808 Oxford Dr | 0.62mi | 4/2.0 (+1) | 1,832 (+3%) | 1mo | $289,000 | $158 | 56 |
| 46 Mcfarland Dr | 0.59mi | 4/2.0 (+1) | 1,723 (-3%) | 4mo | $249,900 | $145 | 55 |
| 1214 Kadison | 0.73mi | 3/2.0 | 1,794 (+1%) | 10mo | $235,000 | $131 | 52 |
| 30 Sydney Ct | 0.50mi | 3/2.0 | 1,600 (-10%) | 5mo | $254,000 | $159 | 52 |
| 1232 Britt Ln | 0.72mi | 3/2.0 | 1,550 (-13%) | 0mo | $250,000 | $161 | 41 |
Match score weights: distance 35% · size 25% · config 20% · recency 20%. Top-matched comps best support the ARV.
Projected returns pro-forma
-3.0% appreciation · 8.0% rent growth · sell at horizon
- IRR
- -20.7%
- Equity multiple
- 0.25×
- Total profit
- $-51,254
- Equity at exit
- $36,530
- IRR
- -6.3%
- Equity multiple
- 0.52×
- Total profit
- $-32,817
- Equity at exit
- $21,183
Cash invested: $68,600 (down + closing). Projections, not guarantees.
Landlord ↔ Tenant lean methodology
- Overall (STATE)
- 81 Strongly Landlord-Friendly
- State Missouri
- 81 Strongly Landlord-Friendly · R+10
- County
- — inherits STATE
- City
- — inherits STATE
ZIP-level market 65401
- Home prices YoY
- -26.4%
- Rents YoY
- 10.2%
- Active inventory
- 268
- Price-to-rent
- 13.1×
Monthly cashflow live
- Estimated rent
- $1,559 medium interval (Pro) →
- Mortgage (P&I)
- −$1,285
- Tax from tax record
- −$154 /mo · $1,850/yr
- Insurance
- −$102
- HOA
- −$0
- Vacancy / Maint / Mgmt
- −$327
- Net cashflow
- $-310
Break-even live
UW: 25.0% down · 7.5% · 30yr · 1.5% tax · 5.0% vac · 8.0% maint · 8.0% mgmt
Financing live
Cash to close
- Down payment
- $61,250
- Closing costs
- $7,350
- Reserves months
- —
- Total cash needed
- —
Loan-product check · same deal, 3 products live
Conventional
25% down · 7.5% · 30yr
- Down + closing
- —
- Monthly P&I
- —
- Monthly cashflow
- —
- DSCR
- —
- Eligible?
- —
Personal DTI + credit; lowest rate.
DSCR
20% down · 8.5% · 30yr
- Down + closing
- —
- Monthly P&I
- —
- Monthly cashflow
- —
- DSCR
- —
- Eligible?
- —
No personal income docs; deal must DSCR.
Hard money
10% down · 12.0% · 12mo
- Down + closing
- —
- Monthly P&I
- —
- Monthly cashflow
- —
- DSCR
- —
- Eligible?
- —
Short-term bridge; refi at stabilization.
Rent comps 2 comps
| Address | Beds | Baths | Sqft | Rent | $/sqft | DOM | Units | Dist |
|---|---|---|---|---|---|---|---|---|
| 903 Oxford Dr Rolla, MO | 3.0 | 2.0 | 2200 | $2,100 | $0.95 | 44d | 1 | 0.56mi |
| 1305 Whitney Ln Rolla, MO | 4.0 | 3.0 | 2400 | $1,825 | $0.76 | 44d | 1 | 1.44mi |
Listing history 3 events
-
2026-05-18status Pending 679-char remark
-
2026-05-11$245,000 Active 679-char remark
-
2003-07-25soldstatus
ⓘ Source: listings_history table (triggers on properties + properties_extension) + one-shot
backfill from property_details.listing_events for pre-trigger history.
Tax reassessment forecast MO · Resets to sale price
- Current annual tax
- $1,850 · $154/mo
- Projected year-2 tax
- $2,376 · $198/mo
- Expected delta
- +$527/yr (+$44/mo · 28.5%)
ⓘ Screening estimate from a state-policy table — verify with the county assessor before closing.
Climate risk First Street
- Flood 1/10 Low FEMA zone X (unshaded) · 0% chance over 30 yrs
- Wildfire 3/10 Moderate
- Heat 5/10 Major 7 d/yr ≥106°F today · 19 d/yr by 30 yrs out
- Wind 2/10 Low
- Air quality 2/10 Low 0 unhealthy d/yr today · 1 by 30 yrs out
Nearby sold comps map
Loading sold comps map…
Walkable amenities ~0.75 mi
Loading nearby amenities…
Taxation est. · year 1
- Rental income
- $18,705
- − Mortgage interest
- −$13,724
- − Property taxes
- −$1,850
- − Insurance
- −$1,225
- − Repairs & maintenance
- −$1,496
- − Management
- −$1,496
- − Depreciation
- −$7,127
- Taxable loss
- −$8,214
- Est. tax savings @ 24.0%
- +$1,971
- After-tax cash flow
- $-1,744/yr
For passive investors: Depreciation is non-cash, so a rental often shows a tax loss while cash-flowing — sheltering income. Rental losses are passive: they offset passive income freely, and up to $25,000/yr can offset ordinary (W-2) income if you actively participate and your MAGI is under $100k (phasing out to $0 by $150k); unused losses carry forward. On sale, claimed depreciation is recaptured at up to 25%, and gains may owe capital-gains tax (a 1031 exchange can defer both). Figures are a year-1 estimate at your 24.0% rate — not tax advice; consult a CPA.
Schools (NCES district)
- District
- Rolla 31
- NCES district ID
- 2926890
- Math proficiency
- 38% ▼ -9.00%
- Reading proficiency
- 48% ▼ -7.00%
- Median HH income
- $40,057
- Composite
- 36.0/100
- National rank
- #4786
- State rank
- #118 of 324 in MO
Livability — Rolla
- Score
- 73/100
- State rank
- #76
- US rank
- #5115
Category grades
Schools grade is shown separately in the Schools card above.
Census & demographics
- Census place
- Rolla, MO
- County
- Phelps County · 42,017 people
- City population
- 32,714
- Metro
- Rolla, MO
- Population (ZIP)
- 32,714
- Household income
- $56,081
- Rent vs Own
- Severe rent burden
- 1122.0
Population outlook (Phelps County) Hauer SSP2
- Today (2025)
- 44,188 people
- By 2030
- 43,524 · -1.5%
- By 2040
- 41,211 · -6.7%
- By 2050
- 38,977 · -11.8%
- By 2075
- 33,846 · -23.4%
- By 2100
- 27,828 · -37.0%
Race, ethnicity, and origin ACS 2023
- Neighborhood character
- Predominantly White (84%)
- Race & ethnicity
- White 84% Two or more races 6% Asian 4% Hispanic / Latino 3% Black 3%
- Common ancestry
- Lithuanian 4% Italian 2% Slovak 2%
- Foreign-born
- 6% · China, Canada
- Languages at home
- 93% English-only · Chinese 2% Spanish 1% Other Indo-European 1%
Political lean MEDSL · Phelps
- 2024 margin
- Solid R (+42.9) · D 27.9% · R 70.8% · Other 1.3%
- 2008→2024 swing
- -20.7pp toward R · 2008: -22.2pp · 2024: -42.9pp
- All cycles
- 2024: R+42.9 2020: R+40.1 2016: R+42.9 2012: R+33.5 2008: R+22.2
Not yet ingested
- Civics
- —
Market trends
- HPI YoY
- ▼ -61.69%
- Current HPI
- 172.421
- Rent YoY
- ▲ 10.25%
- Metro
- Rolla, MO
- State GDP YoY
- ▲ 1.84%
- F500 in state
- 20
Industry mix (Fortune 500 HQ in MO)
| Industry | F500 HQs | Revenue |
|---|---|---|
| Healthcare | 1 | $163B |
|
||
| Insurance | 1 | $21B |
|
||
| Industrial Technology | 1 | $17B |
|
||
| Retail | 1 | $16B |
|
||
| Industrial Distribution | 1 | $10B |
|
||
| Utilities | 1 | $9B |
|
||
Price history
4 events — show timeline
- 2026-06-16 Sold (MLS) — MARIS as Distributed by MLS Grid
- 2026-05-18 Pending — MARIS as Distributed by MLS Grid
- 2026-05-11 Listed $245,000 MARIS as Distributed by MLS Grid
- 2003-07-25 Sold (Public Records) — Public Records
Property tax history
+4.2%/yrLatest (2025): $1,850 · +9.7% YoY. Source: county tax records.
Cash-flow waterfall
monthlySold comps — $/sqft
last 12 mo · ≤1 miLoading sold comps…