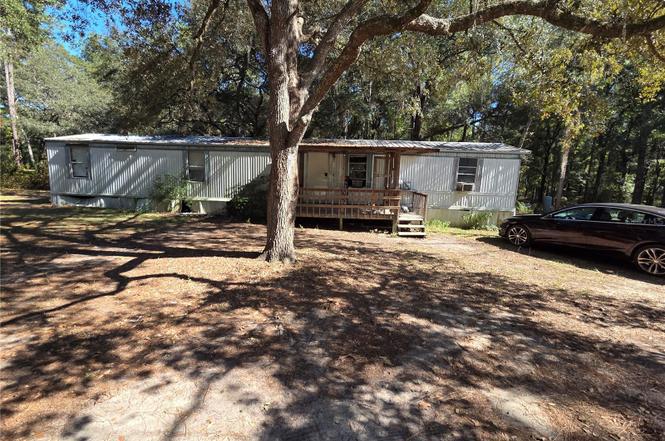
118 Lemon St
Keystone Heights, FL 32666
$82,500B-
3 bd · 2.0 ba ·
938 sqft ·
Built 1994
· Manufactured
· Active
· 211 DOM
Cashflow @ list (25.0% down · 7.5%)
Estimated rent
$1,629/mo
Mortgage (P&I)
−$433
Tax + insurance
−$145
HOA
−$0
Vac / Maint / Mgmt
−$342
Net cashflow
$710/mo
Annual
$8,518/yr
Cap rate
16.62%
Cash-on-cash
36.87%
DSCR
2.64
1% rule
1.97%
Cash to close
$23,100
Investor read
- This is a 3-bed/2.0-bath manufactured listed at $82k.
- At list price, monthly cash flow is $710 ($9k/yr) — positive.
- The deal already cash-flows at list — no discount required.
- Meets the 1% rule at list price ($2k rent vs $82k).
- It's been on market 211 days — a 12% lower offer ($73k) is reasonable based on typical stale-listing flexibility.
- Recommended offer: $73k (12.0% below list) — sets the bar for market timing.
- Local home prices are declining (-3.0%/yr); year-one equity from $570 of loan paydown is wiped out by about $2k of value loss. Plan a longer hold.
- Location reads 80/100 on livability (#109 in FL, #1,684 nationally) — a professional / high-income tenant draw. Strengths: crime A+, cost of living A+, housing A+; Watch: amenities F, commute F.
- Putnam (town): math 34% / reading 39% proficiency, ranked #66 of 73 in FL (top 90%) — families likely to look elsewhere, expect single-tenant / working-renter base with shorter leases; 71% free/reduced lunch — lower-income household profile, screen leases tightly.
- Market conditions: 111 active listings in the ZIP; 113 units permitted in Putnam County in 2024 (0 in 5+ unit buildings).
- Putnam County population projected at -31% by 2050 — secular population decline; favor cash flow + early exit over multi-decade hold.
- 4 sale attempts since 11y ago; this cycle's ask has dropped $18k (18%) from the opening price — seller is motivated, your offer sets the floor, not the list.
- Current owner paid $23k; list at $82k implies a 265% gain — meaningful room to come down on a strong offer.
- At projected returns (-3.0% appreciation + 3.0% rent growth), your $23k cash investment doubles in ~4 years — after that, you're playing with house money.
- Climate carrying-cost: severe wind risk, 99% chance of damaging wind over 30y; major wildfire risk; extreme-heat days projected 6→17/yr by 2055 (HVAC capex compounding) — expect insurance premiums to compound above CPI over the hold.
- Cap rate 16.6% vs local median 3.6% in Keystone Heights — top-decile yield for the area; either an underpriced asset or a hidden risk that comps aren't pricing in. Stress-test before assuming the spread holds.
Questions for listing agent
- It's been on market 211 days. Have you received any prior offers? Is the seller open to a 12% concession, seller financing, or rate buy-down credit?
- Why hasn't it sold? Are there any deal-killer items the seller is aware of (foundation, flood, title, zoning, code violations)?
- Is there a deadline driving the sale (1031 exchange, divorce, estate, relocation)? That informs how much negotiation room exists.
- Schools are A-rated — typically a magnet for longer-tenancy family renters. What's the average tenant stay here, and is there a school-zone premium baked into asking?
- What's the average days-on-market for RENTAL listings here right now (not sales)? A rising rental-DOM trend means longer vacancies and softer asking-rent achievability than the comps imply.
- What's the recent tenant-quality profile in this submarket — average credit score on applications, eviction rate, late-payment / NSF rate, and stable-employment percentage? A property-management company in the area should have these aggregated.
- How much new for-sale + rental construction is in the pipeline within 1–3 miles? Heavy new supply typically softens prices + rents 12–24 months out; constrained supply supports both.
CashFlowRE · CFR-C1SRAV7N91NBPT
· Data 2 days ago
cashflowre.app · 2026-05-29