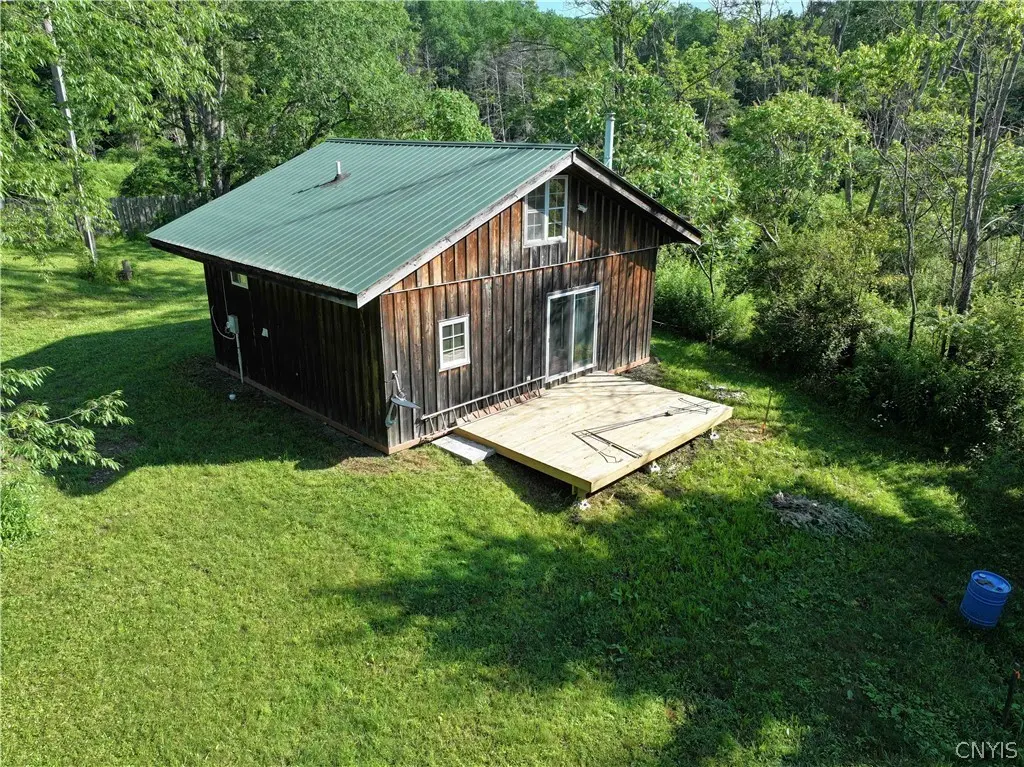
108 Linlyco Lake Rd
Little Valley, NY 14719
$99,900D+
1 bd · 1.0 ba ·
672 sqft ·
Built 2004
· SingleFamily
· Pending
· 14 DOM
Cashflow @ list (25.0% down · 7.5%)
Estimated rent
$804/mo
Mortgage (P&I)
−$524
Tax + insurance
−$269
HOA
−$0
Vac / Maint / Mgmt
−$169
Net cashflow
$-157/mo
Annual
$-1,887/yr
Cap rate
5.91%
Cash-on-cash
-1.37%
DSCR
0.94
1% rule
0.80%
Cash to close
$27,972
Investor read
- This is a 1-bed/1.0-bath single-family listed at $100k.
- At list price, monthly cash flow is $-157 ($-2k/yr) — negative.
- To cash-flow at today's rent, offer at most $72k (27.8% below list).
- To meet the 1% rule (rent ≥ 1% of price), the offer needs to be $80k (19.5% below list).
- Only 14 days on market — expect competitive offers; lowballing is unlikely to land.
- Recommended offer: $72k (27.8% below list) — sets the bar for cash-flow.
- In year one you build about $11k of equity ($691 loan paydown + $10k appreciation (10.0% local appreciation)).
- Location reads 63/100 on livability (#821 in NY) — a middle-class / working-renter tenant base. Strengths: cost of living A+, crime A-, housing A-; Watch: amenities F, commute F, employment D-.
- Cattaraugus-Little Valley Central School District (rural): math 42% / reading 49% proficiency, ranked #460 of 590 in NY (top 78%) — families likely to look elsewhere, expect single-tenant / working-renter base with shorter leases.
- Zoned schools: Cattaraugus-Little Valley Elementary School (math 42% / reading 52%, grade D-, #1,195 of 2,108 statewide, top 60%, 334 students, 55% FRL); Cattaraugus-Little Valley Middle School (math 22% / reading 47%, grade F, #483 of 729 statewide, top 68%, 255 students, 53% FRL); Cattaraugus-Little Valley High School (math 92%, 251 students, 48% FRL).
- Watch-outs: flood insurance adds $125/mo.
- Market conditions: 21 active listings in the ZIP; 128 units permitted in Cattaraugus County in 2024 (21 in 5+ unit buildings).
- Cattaraugus County population projected at -28% by 2050 — secular population decline; favor cash flow + early exit over multi-decade hold.
- 2 sale attempts with the ask held roughly flat each time — persistent listings suggest the price (not the market) is what's stuck; bring a comps-based counter.
- By year 4, paydown + projected appreciation supports a ~$38k cash-out refi (75% LTV) — recoverable capital for the next deal without selling this one.
- Climate carrying-cost: in FEMA flood zone A (mandatory federal flood insurance) — expect insurance premiums to compound above CPI over the hold.
Questions for listing agent
- What do current leases actually rent for vs. the listed asking? Can we see a recent rent roll and the last 12 months of T-12 income?
- What's the actual annual flood-insurance premium (NFIP or private), and is the property in a SFHA with mandatory coverage?
- Is there a deadline driving the sale (1031 exchange, divorce, estate, relocation)? That informs how much negotiation room exists.
- The area grade is low — what's the realistic commute time and amenity access for the typical tenant pool here? Any planned neighborhood developments (good or bad) we should know about?
- This sits on a lake — are riparian / water-frontage rights deeded with the parcel? Any dock permits, shoreline easements, or HOA water-use restrictions?
- What's the documented flood / surge / shoreline-erosion history here (FEMA AND non-FEMA — e.g., storm surge, creek backup, septic-field saturation)?
- Any water-quality or seasonal algae-bloom issues that affect tenant satisfaction or short-term-rental demand?
- What's the average days-on-market for RENTAL listings here right now (not sales)? A rising rental-DOM trend means longer vacancies and softer asking-rent achievability than the comps imply.
CashFlowRE · CFR-C215A2A4Q38B70
· Data 3 weeks ago
cashflowre.app · 2026-05-29