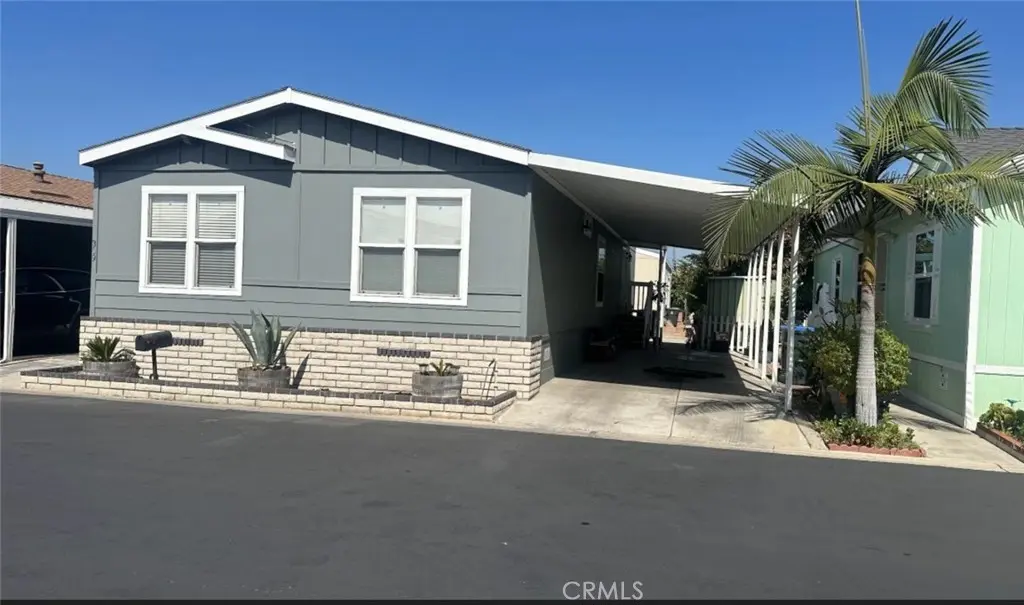
3424 WASHINGTON Ave W #309
Santa Ana, CA 92703
$299,900C+
4 bd · 2.0 ba ·
1,300 sqft ·
Built 2016
· Manufactured
· Active
· 253 DOM
Cashflow @ list (25.0% down · 7.5%)
Estimated rent
$3,446/mo
Mortgage (P&I)
−$1,573
Tax + insurance
−$500
HOA
−$0
Vac / Maint / Mgmt
−$724
Net cashflow
$650/mo
Annual
$7,796/yr
Cap rate
8.89%
Cash-on-cash
9.28%
DSCR
1.41
1% rule
1.15%
Cash to close
$83,972
Investor read
- This is a 4-bed/2.0-bath manufactured listed at $300k. Condition is rated good.
- At list price, monthly cash flow is $650 ($8k/yr) — positive.
- The deal already cash-flows at list — no discount required.
- Meets the 1% rule at list price ($3k rent vs $300k).
- It's been on market 253 days — a 12% lower offer ($264k) is reasonable based on typical stale-listing flexibility.
- Recommended offer: $264k (12.0% below list) — sets the bar for market timing.
- Local home prices are declining (-3.0%/yr); year-one equity from $2k of loan paydown is wiped out by about $9k of value loss. Plan a longer hold.
- Location reads 55/100 on livability (#871 in CA) — a working-class tenant base; expect higher turnover. Strengths: employment A; Watch: schools D, crime D-, amenities F.
- Garden Grove Unified (suburban): math 38% / reading 65% proficiency, ranked #132 of 517 in CA (top 26%) — acceptable for families but not a draw, mixed tenant base, ~2y average lease; 60% free/reduced lunch — lower-income household profile, screen leases tightly.
- Market conditions: 59 active listings in the ZIP; 5 comparable units currently listed for rent nearby; rentals leasing fast (median 2d on market — plan ~1-2 weeks tenant-placement turnaround); solid renter incomes; 6,974 units permitted in Orange County in 2024 (3,839 in 5+ unit buildings).
- Orange County population projected at +14% by 2050 — modest demand growth; plan on rents tracking national, not racing it.
- Climate carrying-cost: extreme-heat days projected 7→23/yr by 2055 (HVAC capex compounding) — expect insurance premiums to compound above CPI over the hold.
- Cap rate 8.9% vs local median 2.5% in Santa Ana — top-decile yield for the area; either an underpriced asset or a hidden risk that comps aren't pricing in. Stress-test before assuming the spread holds.
- At $3,446/mo this rent would consume 49% of the median local household income ($84k/yr) (locally 1835% of renters already pay >50% of income on rent) — very limited rent-growth headroom before tenants either downsize or default.
Questions for listing agent
- It's been on market 253 days. Have you received any prior offers? Is the seller open to a 12% concession, seller financing, or rate buy-down credit?
- Why hasn't it sold? Are there any deal-killer items the seller is aware of (foundation, flood, title, zoning, code violations)?
- Is there a deadline driving the sale (1031 exchange, divorce, estate, relocation)? That informs how much negotiation room exists.
- Schools are D-rated, which usually means shorter tenancies and higher turnover. Who's the typical renter profile here, and what's been the actual vacancy rate?
- Crime grade is D in this area — have there been break-ins, vandalism, or insurance claims at this property in the last 3 years? What carrier currently insures it and at what premium?
- What's the average days-on-market for RENTAL listings here right now (not sales)? A rising rental-DOM trend means longer vacancies and softer asking-rent achievability than the comps imply.
- What's the recent tenant-quality profile in this submarket — average credit score on applications, eviction rate, late-payment / NSF rate, and stable-employment percentage? A property-management company in the area should have these aggregated.
- How much new for-sale + rental construction is in the pipeline within 1–3 miles? Heavy new supply typically softens prices + rents 12–24 months out; constrained supply supports both.
Repairs flagged (vision-AI assessment)
- Minor: kitchen cabinets — dated and could be replaced
- Minor: bathroom fixtures — standard and could be updated
CashFlowRE · CFR-C583TDABZC7XA0
· Data 2 days ago
cashflowre.app · 2026-05-29