3424 WASHINGTON Ave W #309 · Santa Ana, CA
Flood risk 1/10 · Minimal
- FEMA flood zone
- X
- Chance of flooding over 30 yrs
- 0.0%
- Est. flood insurance / yr
- $507 – $1,088
Fire risk 1/10 · Minimal
- Est. fire insurance / yr
- $659 – $1,223
Heat risk 5/10 · Moderate
- Hot days now (above 89°F)
- 7 days/yr
- Hot days in 30 yrs
- 23 days/yr
Wind risk 1/10 · Minimal
- Chance of severe wind over 30 yrs
- —
Air-quality risk 6/10 · Moderate
- Unhealthy air days now
- 12 days/yr
- Unhealthy air days in 30 yrs
- 13 days/yr
Risk factors via First Street. Map © Google.
Why this score? — see what drove the C+ grade
The composite is a weighted blend of 9 inputs, each scored 0–100. Each bar is that input's sub-score; the figure is the points it added to the 100-point composite (weight × sub-score).
- Cash flow +25.0/30.0
- DSCR +8.1/10.0
- ARV discount +7.5/15.0
- 1% rule +6.5/10.0
- Schools +4.5/10.0
- Condition / age +4.0/5.0
- Livability +2.8/5.0
- Rent growth +2.5/5.0
- Appreciation +0.0/10.0
$299,900
🖨 Deal sheet 📄 Offer letter ✓ Due diligence
Listing remarks MLS
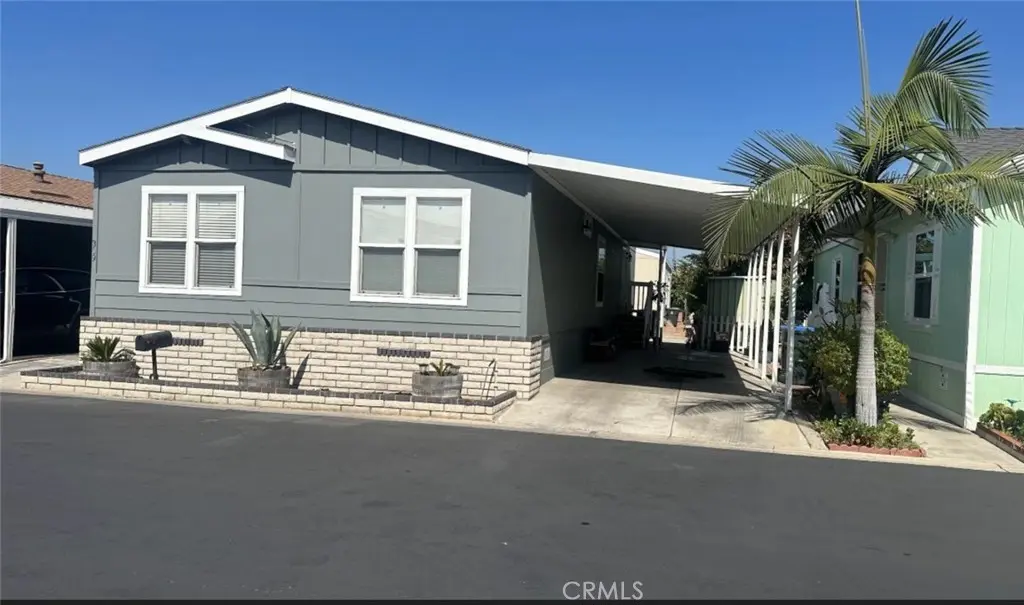
Welcome to this beautifully maintained 4 bedrooms 2 bathrooms, located in a well-established Mobile Park built in 2016, offering approximately 1,300 square feet of living space, open floor provides both funtion and comfort for every day life. Home features laminate wood throughout all areas including 4 bedrooms and 2 baths. Fresh exterior gives the home a clean updated look. Outside you will find at the baclk of the house a storage shed 10X10 and covered carport that can acommodate up to 3 cars. Centrally situated and convenient acccess to the freeway. This home is near shopping mall, dining, schools. Don't miss the opportunity to make this property your next home!
Key facts
- Shopping centers
- Storage shed
- Schools
Tags
Neighborhood map
What this means for you Summary
Snapshot
- This is a 4-bed/2.0-bath manufactured listed at $300k. Condition is rated good.
Deal economics
- At list price, monthly cash flow is $650 ($8k/yr) — positive.
- The deal already cash-flows at list — no discount required.
- Meets the 1% rule at list price ($3k rent vs $300k).
- Recommended offer: $264k (12.0% below list) — sets the bar for market timing.
- Cap rate 8.9% vs local median 2.5% in Santa Ana — top-decile yield for the area; either an underpriced asset or a hidden risk that comps aren't pricing in. Stress-test before assuming the spread holds.
Location & tenants
- Location reads 55/100 on livability (#871 in CA) — a working-class tenant base; expect higher turnover. Strengths: employment A; Watch: schools D, crime D-, amenities F.
- Garden Grove Unified (suburban): math 38% / reading 65% proficiency, ranked #132 of 517 in CA (top 26%) — acceptable for families but not a draw, mixed tenant base, ~2y average lease; 60% free/reduced lunch — lower-income household profile, screen leases tightly.
- Market conditions: 59 active listings in the ZIP; 5 comparable units currently listed for rent nearby; rentals leasing fast (median 2d on market — plan ~1-2 weeks tenant-placement turnaround); solid renter incomes; 6,974 units permitted in Orange County in 2024 (3,839 in 5+ unit buildings).
- At $3,446/mo this rent would consume 49% of the median local household income ($84k/yr) (locally 1835% of renters already pay >50% of income on rent) — very limited rent-growth headroom before tenants either downsize or default.
Forward outlook
- Local home prices are declining (-3.0%/yr); year-one equity from $2k of loan paydown is wiped out by about $9k of value loss. Plan a longer hold.
- Orange County population projected at +14% by 2050 — modest demand growth; plan on rents tracking national, not racing it.
Negotiation context
- It's been on market 253 days — a 12% lower offer ($264k) is reasonable based on typical stale-listing flexibility.
Risks & watch-outs
- Climate carrying-cost: extreme-heat days projected 7→23/yr by 2055 (HVAC capex compounding) — expect insurance premiums to compound above CPI over the hold.
Questions for the listing agent
- It's been on market 253 days. Have you received any prior offers? Is the seller open to a 12% concession, seller financing, or rate buy-down credit?
- Why hasn't it sold? Are there any deal-killer items the seller is aware of (foundation, flood, title, zoning, code violations)?
- Is there a deadline driving the sale (1031 exchange, divorce, estate, relocation)? That informs how much negotiation room exists.
- Schools are D-rated, which usually means shorter tenancies and higher turnover. Who's the typical renter profile here, and what's been the actual vacancy rate?
- Crime grade is D in this area — have there been break-ins, vandalism, or insurance claims at this property in the last 3 years? What carrier currently insures it and at what premium?
- What's the average days-on-market for RENTAL listings here right now (not sales)? A rising rental-DOM trend means longer vacancies and softer asking-rent achievability than the comps imply.
- What's the recent tenant-quality profile in this submarket — average credit score on applications, eviction rate, late-payment / NSF rate, and stable-employment percentage? A property-management company in the area should have these aggregated.
- How much new for-sale + rental construction is in the pipeline within 1–3 miles? Heavy new supply typically softens prices + rents 12–24 months out; constrained supply supports both.
Investment metrics
- 1% rule
- 1.15% ✓
- Cap rate
- 8.89%
- Cash-on-cash
- 9.28%
- DSCR
- 1.41
- GRM
- 7.3
CMA / ARV
- ARV (median comp)
- $166,243
- List price
- $299,900
- Delta
- 80.40%
- Verdict
- OVERPRICED
- Comps
- 14 within 1.0 mi
Show comp detail 7 sales within ~0.75 mi
| Address | Dist | Beds/Ba | Sqft | Sold | Price | $/sf | Match |
|---|---|---|---|---|---|---|---|
| 230 Green Dr | 0.03mi | 3/2.0 (-1) | 1,248 (-4%) | 4mo | $170,000 | $136 | 84 |
| 14300 Clinton St #105 | 0.40mi | 4/2.0 | 1,344 (+3%) | 20mo | $205,000 | $153 | 59 |
| 14300 Clinton St #61 | 0.40mi | 3/2.0 (-1) | 1,440 (+11%) | 5mo | $165,000 | $115 | 54 |
| 14300 CLINTON St N #155 | 0.42mi | 3/2.0 (-1) | 1,344 (+3%) | 20mo | $185,000 | $138 | 53 |
| 14300 Clinton St #64 | 0.40mi | 3/2.0 (-1) | 1,440 (+11%) | 6mo | $245,000 | $170 | 53 |
| 14300 Clinton St #120 | 0.40mi | 3/2.0 (-1) | 1,344 (+3%) | 23mo | $195,000 | $145 | 52 |
| 14300 Clinton St #96 | 0.40mi | 3/3.0 (-1) | 1,440 (+11%) | 7mo | $170,000 | $118 | 49 |
Match score weights: distance 35% · size 25% · config 20% · recency 20%. Top-matched comps best support the ARV.
Projected returns pro-forma
-3.0% appreciation · 3.0% rent growth · sell at horizon
- IRR
- -2.3%
- Equity multiple
- 0.91×
- Total profit
- $-7,169
- Equity at exit
- $44,716
- IRR
- 7.4%
- Equity multiple
- 1.56×
- Total profit
- $47,247
- Equity at exit
- $25,930
Cash invested: $83,972 (down + closing). Projections, not guarantees.
Landlord ↔ Tenant lean methodology
- Overall (STATE)
- 18 Strongly Tenant-Friendly
- State California
- 18 Strongly Tenant-Friendly · D+13
- County
- — inherits STATE
- City
- — inherits STATE
ZIP-level market 92703
- Active inventory
- 59
- Price-to-rent
- 7.3×
Monthly cashflow live
- Estimated rent
- $3,446 high interval (Pro) →
- Mortgage (P&I)
- −$1,573
- Tax est. 1.5%
- −$375 /mo · $4,498/yr
- Insurance
- −$125
- HOA
- −$0
- Vacancy / Maint / Mgmt
- −$724
- Net cashflow
- $650
Break-even live
UW: 25.0% down · 7.5% · 30yr · 1.5% tax · 5.0% vac · 8.0% maint · 8.0% mgmt
Financing live
Cash to close
- Down payment
- $74,975
- Closing costs
- $8,997
- Reserves months
- —
- Total cash needed
- —
Loan-product check · same deal, 3 products live
Conventional
25% down · 7.5% · 30yr
- Down + closing
- —
- Monthly P&I
- —
- Monthly cashflow
- —
- DSCR
- —
- Eligible?
- —
Personal DTI + credit; lowest rate.
DSCR
20% down · 8.5% · 30yr
- Down + closing
- —
- Monthly P&I
- —
- Monthly cashflow
- —
- DSCR
- —
- Eligible?
- —
No personal income docs; deal must DSCR.
Hard money
10% down · 12.0% · 12mo
- Down + closing
- —
- Monthly P&I
- —
- Monthly cashflow
- —
- DSCR
- —
- Eligible?
- —
Short-term bridge; refi at stabilization.
Rent comps 5 comps
| Address | Beds | Baths | Sqft | Rent | $/sqft | DOM | Units | Dist |
|---|---|---|---|---|---|---|---|---|
| 12562 Cardinal Ave Unit B Garden Grove, CA | 3.0 | 1.0 | 1100 | $2,800 | $2.55 | 44d | 1 | 0.64mi |
| 5010 W Maurie Ave Santa Ana, CA | 3.0 | 2.0 | 1580 | $4,000 | $2.53 | 2d | 1 | 1.19mi |
| 13884 Euclid St Unit D07 Garden Grove, CA | 3.0 | 1.5 | 1060 | $3,300 | $3.11 | 2d | 1 | 1.30mi |
| 13884 Euclid St Apt C12 Garden Grove, CA | 3.0 | 1.5 | 1060 | $3,335 | $3.15 | 24d | 1 | 1.30mi |
| 13884 Euclid St Garden Grove, CA | 2.0–3.0 | 1.5 | 980 | $3,300 | $3.37 | 2d | 4 | 1.30mi |
Listing history 15 events
-
2026-06-18days on market $299,900 Active 253 DOM
-
2026-06-17days on market $299,900 Active 252 DOM
-
2026-06-16days on market $299,900 Active 251 DOM
-
2026-06-15days on market $299,900 Active 250 DOM
-
2026-06-13days on market $299,900 Active 248 DOM
-
2026-06-13days on market $299,900 Active 247 DOM
-
2026-06-09days on market $299,900 Active 244 DOM
-
2026-06-08days on market $299,900 Active 243 DOM
-
2026-06-07days on market $299,900 Active 242 DOM
-
2026-06-04days on market $299,900 Active 239 DOM
-
2026-06-03days on market $299,900 Active 238 DOM
-
2026-06-02days on market $299,900 Active 237 DOM
-
2026-06-01days on market $299,900 Active 236 DOM
-
2026-05-31days on market $299,900 Active 235 DOM
-
2025-10-08$299,900 Active 674-char remark
Show marketing remark (674 chars)
Welcome to this beautifully maintained 4 bedrooms 2 bathrooms, located in a well-established Mobile Park built in 2016, offering approximately 1,300 square feet of living space, open floor provides both funtion and comfort for every day life. Home features laminate wood throughout all areas including 4 bedrooms and 2 baths. Fresh exterior gives the home a clean updated look. Outside you will find at the baclk of the house a storage shed 10X10 and covered carport that can acommodate up to 3 cars. Centrally situated and convenient acccess to the freeway. This home is near shopping mall, dining, schools. Don't miss the opportunity to make this property your next home!
ⓘ Source: listings_history table (triggers on properties + properties_extension) + one-shot
backfill from property_details.listing_events for pre-trigger history.
Climate risk First Street
- Flood 1/10 Low FEMA zone X · 0% chance over 30 yrs
- Wildfire 1/10 Low
- Heat 5/10 Major 7 d/yr ≥89°F today · 23 d/yr by 30 yrs out
- Wind 1/10 Low
- Air quality 6/10 Major 12 unhealthy d/yr today · 13 by 30 yrs out
Nearby sold comps map
Loading sold comps map…
Walkable amenities ~0.75 mi
Loading nearby amenities…
Taxation est. · year 1
- Rental income
- $41,350
- − Mortgage interest
- −$16,799
- − Property taxes
- −$4,498
- − Insurance
- −$1,500
- − Repairs & maintenance
- −$3,308
- − Management
- −$3,308
- − Depreciation
- −$8,724
- Taxable income
- $3,212
- Est. tax owed @ 24.0%
- −$771
- After-tax cash flow
- $7,025/yr
For passive investors: Depreciation is non-cash, so a rental often shows a tax loss while cash-flowing — sheltering income. Rental losses are passive: they offset passive income freely, and up to $25,000/yr can offset ordinary (W-2) income if you actively participate and your MAGI is under $100k (phasing out to $0 by $150k); unused losses carry forward. On sale, claimed depreciation is recaptured at up to 25%, and gains may owe capital-gains tax (a 1031 exchange can defer both). Figures are a year-1 estimate at your 24.0% rate — not tax advice; consult a CPA.
Condition & rehab AI · 12 photos
This home is in good condition with fresh exterior paint and laminate flooring throughout. It has potential for a cosmetic update to the kitchen and bathrooms to increase its resale and rental value.
Repairs flagged
- Minor kitchen cabinets — dated and could be replaced
- Minor bathroom fixtures — standard and could be updated
Value-add opportunities
- Both paint interior walls — Fresh paint can improve the home's appearance and value
- Resale update kitchen cabinets — Modern cabinets can significantly enhance the home's appeal and value
- Resale update bathroom fixtures — Modern fixtures can improve the home's appeal and value
Renovation cost estimate screening
| Repair item | Severity | Est. cost |
|---|---|---|
| kitchen cabinets · dated and could be replaced | Minor | $500–3,000 |
| bathroom fixtures · standard and could be updated | Minor | $500–3,000 |
| Total estimated repair cost · 2 items | $1,000–6,000 |
Value-add ROI direction
- Both paint interior walls — Fresh paint can improve the home's appearance and value ↑
- Resale update kitchen cabinets — Modern cabinets can significantly enhance the home's appeal and value ↑
- Resale update bathroom fixtures — Modern fixtures can improve the home's appeal and value ↑
ⓘ Cost ranges are severity-bucket heuristics (US national rule-of-thumb). Get contractor quotes + a written scope before underwriting a rehab budget.
Schools (NCES district)
- District
- Garden Grove Unified
- NCES district ID
- 0614880
- Math proficiency
- 38% ▼ -14.00%
- Reading proficiency
- 65% ▲ 4.00%
- Median HH income
- $60,089
- Composite
- 44.89/100
- National rank
- #2715
- State rank
- #132 of 517 in CA
Livability — Santa Ana
- Score
- 55/100
- State rank
- #871
- US rank
- #23502
Category grades
Schools grade is shown separately in the Schools card above.
Census & demographics
- Census place
- Santa Ana, CA
- County
- Orange County · 3,096,323 people
- City population
- 288,255
- Metro
- Los Angeles-Long Beach-Anaheim, CA
- Population (ZIP)
- 62,447
- Household income
- $84,437
- Rent vs Own
- Severe rent burden
- 1835.0
Population outlook (Orange County) Hauer SSP2
- Today (2025)
- 3,477,456 people
- By 2030
- 3,613,117 · +3.9%
- By 2040
- 3,835,945 · +10.3%
- By 2050
- 3,968,736 · +14.1%
- By 2075
- 4,097,053 · +17.8%
- By 2100
- 3,903,633 · +12.3%
Race, ethnicity, and origin ACS 2023
- Neighborhood character
- Predominantly Hispanic (77%)
- Race & ethnicity
- Hispanic / Latino 77% Two or more races 19% Asian 16% White 5% Native American 2%
- Hispanic origin (detail)
- Mexican 72%
- Common ancestry
- Iranian 1%
- Foreign-born
- 47% · Canada, Vietnam, China
- Languages at home
- 17% English-only · Spanish 68% Vietnamese 13% Other Asian/Pacific 1%
Political lean MEDSL · Orange
- 2024 margin
- Toss-up / Even · D 49.7% · R 47.1% · Other 3.2%
- 2008→2024 swing
- +5.2pp toward D · 2008: -2.6pp · 2024: 2.6pp
- All cycles
- 2024: D+2.6 2020: D+9.0 2016: D+7.7 2012: R+8.3 2008: R+2.6
Not yet ingested
- Civics
- —
Market trends
- HPI YoY
- ▼ -666.61%
- Current HPI
- 458.1824
- Rent YoY
- —
- Metro
- Los Angeles-Long Beach-Anaheim, CA
- State GDP YoY
- ▲ 3.21%
- F500 in state
- 116
Industry mix (Fortune 500 HQ in CA)
| Industry | F500 HQs | Revenue |
|---|---|---|
| Technology | 27 | $1,492B |
|
||
| Financial Services | 3 | $174B |
|
||
| Retail | 3 | $44B |
|
||
| Insurance | 3 | $26B |
|
||
| Media / Entertainment | 2 | $115B |
|
||
| Pharmaceuticals / Biotech | 2 | $62B |
|
||
Price history
1 event — show timeline
- 2025-10-08 Listed $299,900 CRMLS
Cash-flow waterfall
monthlySold comps — $/sqft
last 12 mo · ≤1 miLoading sold comps…