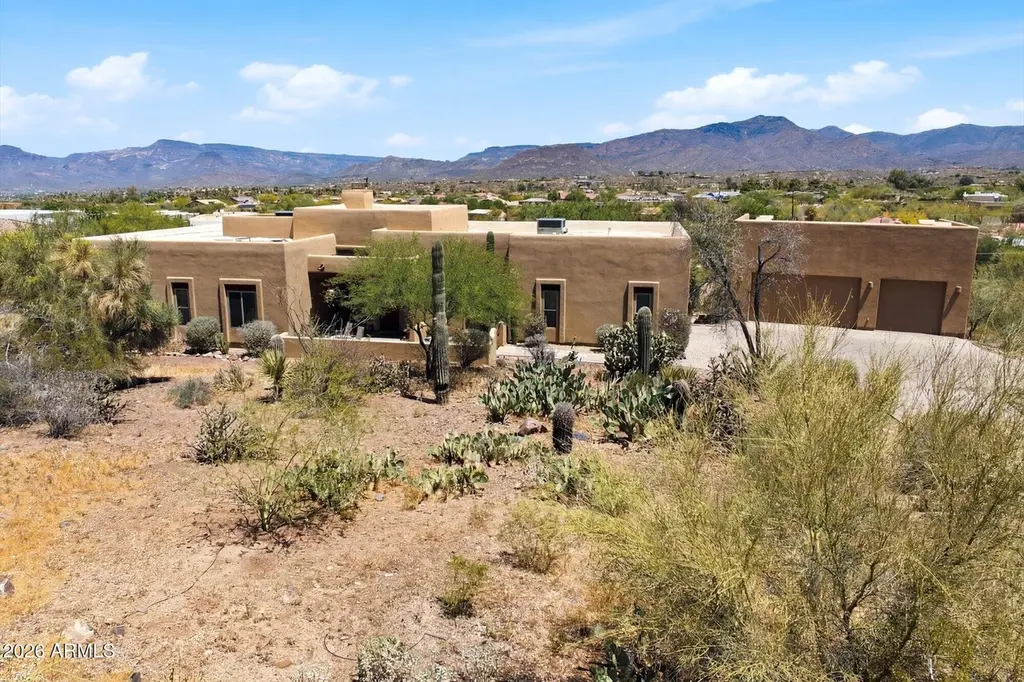
7676 E Nonchalant Ave
Carefree, AZ 85377
$1,250,000F
4 bd · 4.0 ba ·
2,209 sqft ·
Built 1989
· SingleFamily
· Active
· 17 DOM
Cashflow @ list (25.0% down · 7.5%)
Estimated rent
$8,954/mo
Mortgage (P&I)
−$6,555
Tax + insurance
−$2,083
HOA
−$0
Vac / Maint / Mgmt
−$1,880
Net cashflow
$-1,565/mo
Annual
$-18,781/yr
Cap rate
4.79%
Cash-on-cash
-5.37%
DSCR
0.76
1% rule
0.72%
Cash to close
$350,000
Investor read
- This is a 4-bed/4.0-bath single-family listed at $1.25M.
- At list price, monthly cash flow is $-2k ($-19k/yr) — negative.
- To cash-flow at today's rent, offer at most $1.02M (18.1% below list).
- To meet the 1% rule (rent ≥ 1% of price), the offer needs to be $895k (28.4% below list).
- It's been on market 17 days — a 2% lower offer ($1.23M) is reasonable based on typical stale-listing flexibility.
- Recommended offer: $895k (28.4% below list) — sets the bar for 1% rule.
- In year one you build about $85k of equity ($9k loan paydown + $77k appreciation (6.1% local appreciation)).
- Location reads 68/100 on livability (#58 in AZ) — a middle-class / working-renter tenant base. Strengths: crime A+, employment A+; Watch: amenities D+, health & safety D+, commute F.
- Cave Creek Unified District (4244) (urban): math 57% / reading 59% proficiency, ranked #13 of 249 in AZ (top 5%) — acceptable for families but not a draw, mixed tenant base, ~2y average lease; only 8% free/reduced lunch — higher-income household profile.
- Zoned schools: Black Mountain Elementary School (math 66% / reading 63%, grade B, #104 of 1,109 statewide, top 10%, 495 students, 8% FRL); Sonoran Trails Middle School (math 48% / reading 50%, grade C-, #31 of 218 statewide, top 14%, 761 students, 7% FRL); Cactus Shadows High School (math 49% / reading 46%, grade D, #48 of 381 statewide, top 13%, 1,588 students, 6% FRL) — zoned schools at 7% FRL track the district average.
- Market conditions: 101 active listings in the ZIP; 8 comparable units currently listed for rent nearby; rentals lingering (median 44d on market — plan ~5-8 weeks vacancy on turnover, expect pricing pressure); 88% of comp listings sitting > 30 days — soft ceiling on asking rent; 36,011 units permitted in Maricopa County in 2024 (12,801 in 5+ unit buildings).
- Maricopa County population projected at +38% by 2050 — long-run rental-demand tailwind backs the buy-and-hold thesis.
- 5 sale attempts since 22y ago with the ask held roughly flat each time — persistent listings suggest the price (not the market) is what's stuck; bring a comps-based counter.
- Current owner paid $350k; list at $1.25M implies a 257% gain — meaningful room to come down on a strong offer.
- By year 2, paydown + projected appreciation supports a ~$136k cash-out refi (75% LTV) — recoverable capital for the next deal without selling this one.
- Climate carrying-cost: moderate wildfire risk; extreme-heat days projected 7→19/yr by 2055 (HVAC capex compounding) — expect insurance premiums to compound above CPI over the hold.
Questions for listing agent
- What do current leases actually rent for vs. the listed asking? Can we see a recent rent roll and the last 12 months of T-12 income?
- Is there a deadline driving the sale (1031 exchange, divorce, estate, relocation)? That informs how much negotiation room exists.
- The area grade is low — what's the realistic commute time and amenity access for the typical tenant pool here? Any planned neighborhood developments (good or bad) we should know about?
- What's the average days-on-market for RENTAL listings here right now (not sales)? A rising rental-DOM trend means longer vacancies and softer asking-rent achievability than the comps imply.
- What's the recent tenant-quality profile in this submarket — average credit score on applications, eviction rate, late-payment / NSF rate, and stable-employment percentage? A property-management company in the area should have these aggregated.
- How much new for-sale + rental construction is in the pipeline within 1–3 miles? Heavy new supply typically softens prices + rents 12–24 months out; constrained supply supports both.
CashFlowRE · CFR-C6G0J71NPMS28Y
· Data 2 days ago
cashflowre.app · 2026-05-29