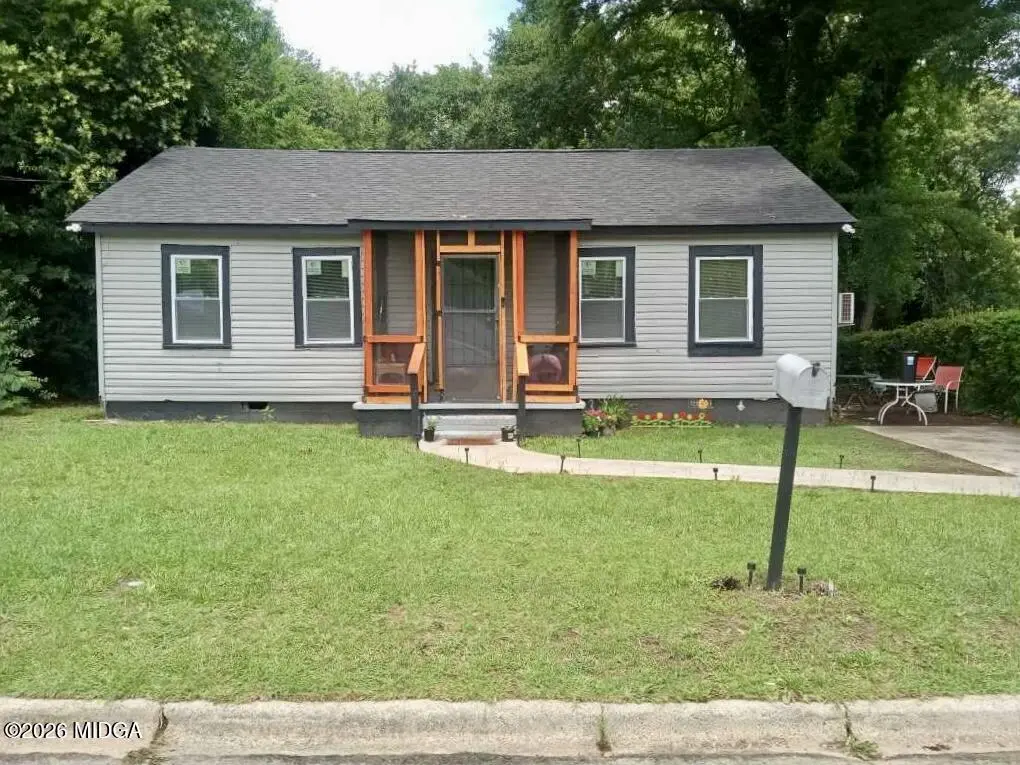
791 Lynmore Ave
Macon-Bibb County, GA 31206
$80,000C
2 bd · 1.0 ba ·
988 sqft ·
Built 1947
· SingleFamily
· Active
· 11 DOM
Cashflow @ list (25.0% down · 7.5%)
Estimated rent
$974/mo
Mortgage (P&I)
−$420
Tax + insurance
−$62
HOA
−$0
Vac / Maint / Mgmt
−$205
Net cashflow
$288/mo
Annual
$3,461/yr
Cap rate
10.62%
Cash-on-cash
15.45%
DSCR
1.69
1% rule
1.22%
Cash to close
$22,400
Investor read
- This is a 2-bed/1.0-bath single-family listed at $80k.
- At list price, monthly cash flow is $288 ($3k/yr) — positive.
- The deal already cash-flows at list — no discount required.
- Meets the 1% rule at list price ($974 rent vs $80k).
- Only 11 days on market — expect competitive offers; lowballing is unlikely to land.
- Local home prices are declining (-3.0%/yr); year-one equity from $553 of loan paydown is wiped out by about $2k of value loss. Plan a longer hold.
- Location reads: area grade C — affects rentability + tenant quality, not the cash-flow math above.
- Bibb County (urban): math 11% / reading 18% proficiency, ranked #161 of 174 in GA (top 92%) — low school quality limits family demand, transient renter base, plan for 1-2y turnover; 75% free/reduced lunch — lower-income household profile, screen leases tightly.
- Zoned schools: Bruce Elementary School (math 2% / reading 2%, grade F, #1,204 of 1,228 statewide, top 100%, 434 students, 100% FRL); Rutland Middle School (math 12% / reading 28%, grade F, #349 of 470 statewide, top 75%, 812 students, 100% FRL); Rutland High School (math 2% / reading 8%, grade F, #394 of 424 statewide, top 97%, 907 students, 100% FRL) — zoned schools average 100% FRL vs 75% district-wide (25 pts higher); higher-poverty schools than district average — tighter screening recommended.
- Watch-outs: built in 1947 — expect roof / HVAC / electrical / plumbing capex.
- Market conditions: Rents rising fast (+5.0%/yr); 207 active listings in the ZIP; 27 comparable units currently listed for rent nearby; rentals lingering (median 44d on market — plan ~5-8 weeks vacancy on turnover, expect pricing pressure); 67% of comp listings sitting > 30 days — soft ceiling on asking rent; lower-income renter base — watch delinquency; 154 units permitted in Bibb County in 2024 (0 in 5+ unit buildings).
- Bibb County population projected at -12% by 2050 — secular population decline; favor cash flow + early exit over multi-decade hold.
- Current owner paid $11k; list at $80k implies a 621% gain — meaningful room to come down on a strong offer.
- At projected returns (-3.0% appreciation + 5.0% rent growth), your $22k cash investment doubles in ~7 years — after that, you're playing with house money.
- Climate carrying-cost: major wind risk, 72% chance of damaging wind over 30y; extreme-heat days projected 7→17/yr by 2055 (HVAC capex compounding) — expect insurance premiums to compound above CPI over the hold.
- Cap rate 10.6% vs local median 5.4% in Macon-Bibb County — top-decile yield for the area; either an underpriced asset or a hidden risk that comps aren't pricing in. Stress-test before assuming the spread holds.
- This rent runs 39% of the median local income ($30k/yr) — at the standard rent-burdened threshold; future hikes will face affordability resistance.
Questions for listing agent
- Built in 1947 — when were the roof, HVAC, electrical panel, plumbing, and water heater last replaced?
- Is there a deadline driving the sale (1031 exchange, divorce, estate, relocation)? That informs how much negotiation room exists.
- What's the average days-on-market for RENTAL listings here right now (not sales)? A rising rental-DOM trend means longer vacancies and softer asking-rent achievability than the comps imply.
- What's the recent tenant-quality profile in this submarket — average credit score on applications, eviction rate, late-payment / NSF rate, and stable-employment percentage? A property-management company in the area should have these aggregated.
- How much new for-sale + rental construction is in the pipeline within 1–3 miles? Heavy new supply typically softens prices + rents 12–24 months out; constrained supply supports both.
CashFlowRE · CFR-C7QHS75M2CRADT
· Data 1 day ago
cashflowre.app · 2026-05-29