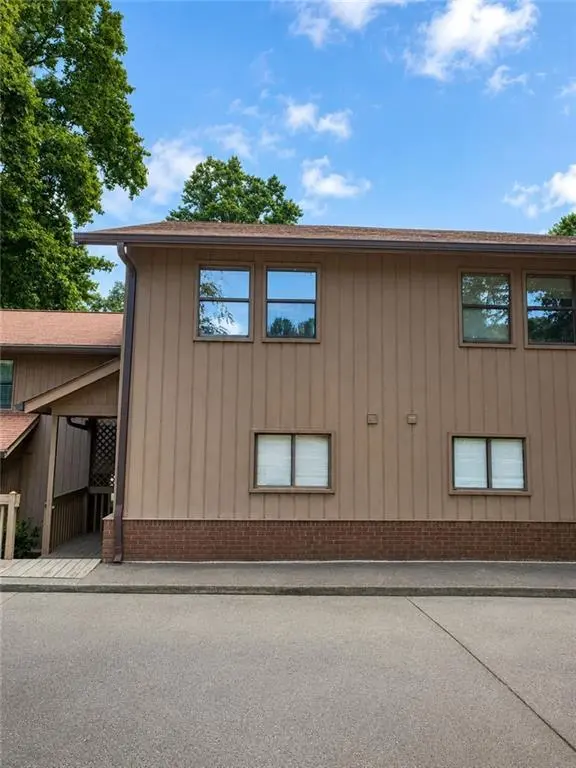
1102 Pine Tree Dr #1102
Buford, GA 30518
$199,900B-
3 bd · 2.5 ba ·
1,372 sqft ·
Built 1985
· Townhouse
· Active
· 13 DOM
Cashflow @ list (25.0% down · 7.5%)
Estimated rent
$2,565/mo
Mortgage (P&I)
−$1,048
Tax + insurance
−$333
HOA
−$250
Vac / Maint / Mgmt
−$539
Net cashflow
$395/mo
Annual
$4,736/yr
Cap rate
8.66%
Cash-on-cash
8.46%
DSCR
1.38
1% rule
1.28%
Cash to close
$55,972
Investor read
- This is a 3-bed/2.5-bath townhouse listed at $200k.
- At list price, monthly cash flow is $395 ($5k/yr) — positive.
- The deal already cash-flows at list — no discount required.
- Meets the 1% rule at list price ($3k rent vs $200k).
- Only 13 days on market — expect competitive offers; lowballing is unlikely to land.
- Local home prices are declining (-3.0%/yr); year-one equity from $1k of loan paydown is wiped out by about $6k of value loss. Plan a longer hold.
- Location reads 70/100 on livability (#96 in GA) — a middle-class / working-renter tenant base. Strengths: housing A+, health & safety A, cost of living B+; Watch: amenities F, commute F.
- Buford City (suburban): math 67% / reading 61% proficiency, ranked #6 of 174 in GA (top 3%) — acceptable for families but not a draw, mixed tenant base, ~2y average lease.
- Zoned schools: Buford Academy (math 71% / reading 64%, grade B+, #76 of 1,228 statewide, top 6%, 1,297 students, 32% FRL); Buford Middle School (math 68% / reading 65%, grade A-, #24 of 470 statewide, top 5%, 1,426 students, 33% FRL); Buford High School (math 61% / reading 32%, grade D-, #41 of 424 statewide, top 10%, 1,846 students, 30% FRL).
- Market conditions: Rents soft (-2.0%/yr); 590 active listings in the ZIP; 5 comparable units currently listed for rent nearby; rentals lingering (median 44d on market — plan ~5-8 weeks vacancy on turnover, expect pricing pressure); 60% of comp listings sitting > 30 days — soft ceiling on asking rent; solid renter incomes; 5,607 units permitted in Gwinnett County in 2024 (1,277 in 5+ unit buildings).
- Gwinnett County population projected at +47% by 2050 — long-run rental-demand tailwind backs the buy-and-hold thesis.
- Current owner paid $54k; list at $200k implies a 274% gain — meaningful room to come down on a strong offer.
- Climate carrying-cost: extreme-heat days projected 7→18/yr by 2055 (HVAC capex compounding) — expect insurance premiums to compound above CPI over the hold.
- Cap rate 8.7% vs local median 3.0% in Buford — top-decile yield for the area; either an underpriced asset or a hidden risk that comps aren't pricing in. Stress-test before assuming the spread holds.
- This rent runs 32% of the median local income ($97k/yr) — at the standard rent-burdened threshold; future hikes will face affordability resistance.
Questions for listing agent
- What does the HOA fee cover, when was the last increase, and are there any pending special assessments or reserve-fund shortfalls?
- Is there a deadline driving the sale (1031 exchange, divorce, estate, relocation)? That informs how much negotiation room exists.
- Schools are B-rated — typically a magnet for longer-tenancy family renters. What's the average tenant stay here, and is there a school-zone premium baked into asking?
- What's the average days-on-market for RENTAL listings here right now (not sales)? A rising rental-DOM trend means longer vacancies and softer asking-rent achievability than the comps imply.
- What's the recent tenant-quality profile in this submarket — average credit score on applications, eviction rate, late-payment / NSF rate, and stable-employment percentage? A property-management company in the area should have these aggregated.
- How much new for-sale + rental construction is in the pipeline within 1–3 miles? Heavy new supply typically softens prices + rents 12–24 months out; constrained supply supports both.
CashFlowRE · CFR-C7S4JHC8TRH86Y
· Data 2 days ago
cashflowre.app · 2026-05-29