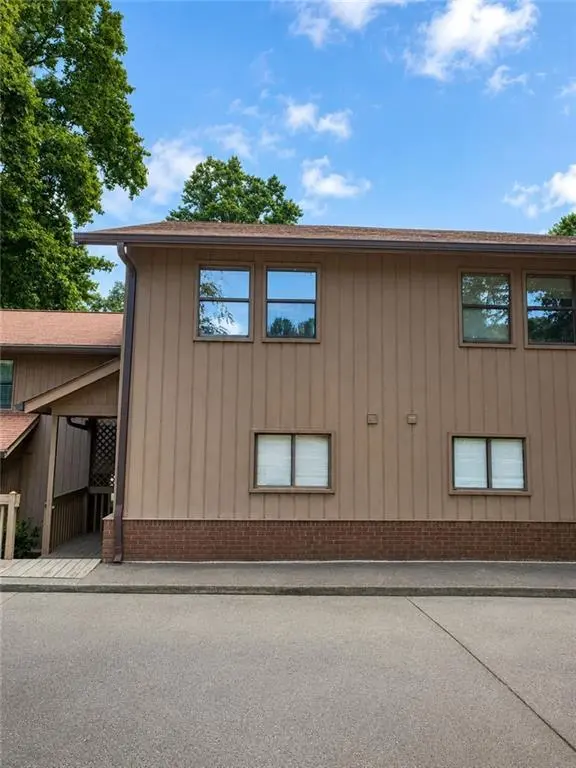
1102 Pine Tree Dr #1102 · Buford, GA
Flood risk 1/10 · Minimal
- FEMA flood zone
- X (unshaded)
- Chance of flooding over 30 yrs
- 0.0%
- Est. flood insurance / yr
- $507 – $1,088
Fire risk 3/10 · Minor
- Est. fire insurance / yr
- $963 – $1,789
Heat risk 5/10 · Moderate
- Hot days now (above 103°F)
- 7 days/yr
- Hot days in 30 yrs
- 18 days/yr
Wind risk 4/10 · Minor
- Chance of severe wind over 30 yrs
- 15.0%
Air-quality risk 4/10 · Minor
- Unhealthy air days now
- 6 days/yr
- Unhealthy air days in 30 yrs
- 7 days/yr
Risk factors via First Street. Map © Google.
Why this score? — see what drove the B- grade
The composite is a weighted blend of 9 inputs, each scored 0–100. Each bar is that input's sub-score; the figure is the points it added to the 100-point composite (weight × sub-score).
- Cash flow +24.1/30.0
- ARV discount +15.0/15.0
- 1% rule +7.8/10.0
- DSCR +7.8/10.0
- Schools +5.4/10.0
- Livability +3.5/5.0
- Condition / age +2.5/5.0
- Rent growth +2.0/5.0
- Appreciation +0.0/10.0
$199,900
🖨 Deal sheet 📄 Offer letter ✓ Due diligence
Listing remarks
Welcome to 1102 Pine Tree Drive in sought-after Buford, GA! Located in the Lanier Harbor Townhomes community, this charming property offers an incredible opportunity to enjoy a convenient lifestyle near Lake Lanier, downtown Buford, shopping, dining, parks, and major commuter routes. Residents can enjoy access to 1 of 3 shared docks on Lake Lanier, making it easy to take in the lake lifestyle right from the community. The lower level of the building offers additional space that may be ideal for storage, hobbies, or a workshop. Situated in the highly desirable Buford City School district, this home is ideal for buyers looking for location, value, and everyday convenience or investors looking
Key facts
- Sought-after buford
- $250 HOA
- Parking
Tags
Property features AI
Finance
- HOA & community: Monthly HOA fee of $250; Association also has annual fees; Association covers grounds and structure maintenance, pest control, sewer, termite treatment and water; Community features include a community dock, lake access, homeowners association and RV/boat storage; Community contains 111 units
Exterior
- Parking: One total parking space; Kitchen-level parking lot access; Unassigned parking with RV access/parking
- Utilities: Public water; Public sewer; 110 volt electric; Cable available, phone available, underground utilities, water available, sewer available, electricity available
- Home design: Two levels; Townhome (fee simple ownership)
- Construction: Vinyl siding; Composition roof; Combination foundation; Resale property
- Exterior features: Private entrance; Storage; Deck that is enclosed and screened; Shared dock on the lake; RV/boat storage
Interior
- Kitchen: White cabinets with other surface countertops; Dishwasher; Electric oven and electric range; Microwave; Refrigerator
- Bedrooms: Two upper-level bedrooms; Roommate floor plan
- Flooring: Carpet; Laminate
- Bathrooms: Two full bathrooms; One main-level bathroom; Master bath with tub/shower combo
- Heating & cooling: Central forced air heating (electric); Ceiling fans and electric cooling
- Interior features: One fireplace with glass doors serving the family room and living room; Disappearing attic stairs and permanent attic stairs; 1 common wall (townhome); Attic, basement, workshop and other finished/unfinished rooms; Basement with dirt floor, exterior entry and unfinished space
- Laundry & utility: Washer and dryer included; Electric dryer hookup; Laundry located in kitchen in a laundry closet on the main level
Neighborhood map
What this means for you Summary
Snapshot
- This is a 3-bed/2.5-bath townhouse listed at $200k.
Deal economics
- At list price, monthly cash flow is $395 ($5k/yr) — positive.
- The deal already cash-flows at list — no discount required.
- Meets the 1% rule at list price ($3k rent vs $200k).
- Cap rate 8.7% vs local median 3.0% in Buford — top-decile yield for the area; either an underpriced asset or a hidden risk that comps aren't pricing in. Stress-test before assuming the spread holds.
Location & tenants
- Location reads 70/100 on livability (#96 in GA) — a middle-class / working-renter tenant base. Strengths: housing A+, health & safety A, cost of living B+; Watch: amenities F, commute F.
- Buford City (suburban): math 67% / reading 61% proficiency, ranked #6 of 174 in GA (top 3%) — acceptable for families but not a draw, mixed tenant base, ~2y average lease.
- Zoned schools: Buford Academy (math 71% / reading 64%, grade B+, #76 of 1,228 statewide, top 6%, 1,297 students, 32% FRL); Buford Middle School (math 68% / reading 65%, grade A-, #24 of 470 statewide, top 5%, 1,426 students, 33% FRL); Buford High School (math 61% / reading 32%, grade D-, #41 of 424 statewide, top 10%, 1,846 students, 30% FRL).
- Market conditions: Rents soft (-2.0%/yr); 590 active listings in the ZIP; 5 comparable units currently listed for rent nearby; rentals lingering (median 44d on market — plan ~5-8 weeks vacancy on turnover, expect pricing pressure); 60% of comp listings sitting > 30 days — soft ceiling on asking rent; solid renter incomes; 5,607 units permitted in Gwinnett County in 2024 (1,277 in 5+ unit buildings).
- This rent runs 32% of the median local income ($97k/yr) — at the standard rent-burdened threshold; future hikes will face affordability resistance.
Forward outlook
- Local home prices are declining (-3.0%/yr); year-one equity from $1k of loan paydown is wiped out by about $6k of value loss. Plan a longer hold.
- Gwinnett County population projected at +47% by 2050 — long-run rental-demand tailwind backs the buy-and-hold thesis.
Negotiation context
- Only 13 days on market — expect competitive offers; lowballing is unlikely to land.
- Current owner paid $54k; list at $200k implies a 274% gain — meaningful room to come down on a strong offer.
Risks & watch-outs
- Climate carrying-cost: extreme-heat days projected 7→18/yr by 2055 (HVAC capex compounding) — expect insurance premiums to compound above CPI over the hold.
Questions for the listing agent
- What does the HOA fee cover, when was the last increase, and are there any pending special assessments or reserve-fund shortfalls?
- Is there a deadline driving the sale (1031 exchange, divorce, estate, relocation)? That informs how much negotiation room exists.
- Schools are B-rated — typically a magnet for longer-tenancy family renters. What's the average tenant stay here, and is there a school-zone premium baked into asking?
- What's the average days-on-market for RENTAL listings here right now (not sales)? A rising rental-DOM trend means longer vacancies and softer asking-rent achievability than the comps imply.
- What's the recent tenant-quality profile in this submarket — average credit score on applications, eviction rate, late-payment / NSF rate, and stable-employment percentage? A property-management company in the area should have these aggregated.
- How much new for-sale + rental construction is in the pipeline within 1–3 miles? Heavy new supply typically softens prices + rents 12–24 months out; constrained supply supports both.
Investment metrics
- 1% rule
- 1.28% ✓
- Cap rate
- 8.66%
- Cash-on-cash
- 8.46%
- DSCR
- 1.38
- GRM
- 6.5
CMA / ARV
- ARV (on-the-fly)
- $270,284
- Comps found
- 4
Show comp detail 4 sales within ~0.75 mi
| Address | Dist | Beds/Ba | Sqft | Sold | Price | $/sf | Match |
|---|---|---|---|---|---|---|---|
| 1802 Pine Tree Dr | 0.03mi | 2/2.5 (-1) | 1,372 (0%) | 17mo | $269,900 | $197 | 79 |
| 1702 Pine Tree Dr | 0.03mi | 2/2.5 (-1) | 1,372 (0%) | 18mo | $230,000 | $168 | 79 |
| 1704 Pine Tree Dr | 0.03mi | 2/2.5 (-1) | 1,440 (+5%) | 21mo | $260,000 | $181 | 68 |
| 304 Pine Tree Dr | 0.07mi | 3/2.0 | 1,566 (+14%) | 22mo | $323,000 | $206 | 53 |
Match score weights: distance 35% · size 25% · config 20% · recency 20%. Top-matched comps best support the ARV.
Projected returns pro-forma
-3.0% appreciation · 0.0% rent growth · sell at horizon
- IRR
- -7.3%
- Equity multiple
- 0.74×
- Total profit
- $-14,579
- Equity at exit
- $29,806
- IRR
- -2.7%
- Equity multiple
- 0.85×
- Total profit
- $-8,593
- Equity at exit
- $17,284
Cash invested: $55,972 (down + closing). Projections, not guarantees.
Landlord ↔ Tenant lean methodology
- Overall (STATE)
- 90 Strongly Landlord-Friendly
- State Georgia
- 90 Strongly Landlord-Friendly · R+3
- County
- — inherits STATE
- City
- — inherits STATE
ZIP-level market 30518
- Home prices YoY
- -34.7%
- Rents YoY
- -2.0%
- Active inventory
- 590
- Price-to-rent
- 6.5×
Monthly cashflow live
- Estimated rent
- $2,565 high interval (Pro) →
- Mortgage (P&I)
- −$1,048
- Tax est. 1.5%
- −$250 /mo · $2,998/yr
- Insurance
- −$83
- HOA
- −$250
- Vacancy / Maint / Mgmt
- −$539
- Net cashflow
- $395
Break-even live
UW: 25.0% down · 7.5% · 30yr · 1.5% tax · 5.0% vac · 8.0% maint · 8.0% mgmt
Financing live
Cash to close
- Down payment
- $49,975
- Closing costs
- $5,997
- Reserves months
- —
- Total cash needed
- —
Loan-product check · same deal, 3 products live
Conventional
25% down · 7.5% · 30yr
- Down + closing
- —
- Monthly P&I
- —
- Monthly cashflow
- —
- DSCR
- —
- Eligible?
- —
Personal DTI + credit; lowest rate.
DSCR
20% down · 8.5% · 30yr
- Down + closing
- —
- Monthly P&I
- —
- Monthly cashflow
- —
- DSCR
- —
- Eligible?
- —
No personal income docs; deal must DSCR.
Hard money
10% down · 12.0% · 12mo
- Down + closing
- —
- Monthly P&I
- —
- Monthly cashflow
- —
- DSCR
- —
- Eligible?
- —
Short-term bridge; refi at stabilization.
Rent comps 5 comps
| Address | Beds | Baths | Sqft | Rent | $/sqft | DOM | Units | Dist |
|---|---|---|---|---|---|---|---|---|
| 6265 Lakeview Dr Buford, GA | 3.0 | 2.0 | 1440 | $3,200 | $2.22 | 44d | 1 | 0.46mi |
| 5722 Port Dr Buford, GA | 3.0 | 2.0 | 1500 | $2,350 | $1.57 | 17d | 1 | 0.71mi |
| 5712 Port Dr Buford, GA | 3.0 | 2.0 | 1459 | $2,299 | $1.58 | 24d | 1 | 0.72mi |
| 2035 Patrick Mill Pl Buford, GA | 3.0 | 2.5 | 1699 | $2,445 | $1.44 | 44d | 1 | 0.82mi |
| 2243 Bedstone Dr Buford, GA | 4.0 | 2.0 | 1597 | $2,190 | $1.37 | 44d | 1 | 0.95mi |
HOA detail
- Monthly dues
- $250 · $3,000/yr
Listing history 10 events
-
2026-06-18days on market $199,900 Active 13 DOM
-
2026-06-17days on market $199,900 Active 12 DOM
-
2026-06-16days on market $199,900 Active 11 DOM
-
2026-06-15days on market $199,900 Active 10 DOM
-
2026-06-13days on market $199,900 Active 8 DOM
-
2026-06-13days on market $199,900 Active 7 DOM
-
2026-06-09days on market $199,900 Active 4 DOM
-
2026-06-08days on market $199,900 Active 3 DOM
-
2026-06-07remarks 699-char remark
-
2026-06-07$199,900 Active 2 DOM
ⓘ Source: listings_history table (triggers on properties + properties_extension) + one-shot
backfill from property_details.listing_events for pre-trigger history.
Climate risk First Street
- Flood 1/10 Low FEMA zone X (unshaded) · 0% chance over 30 yrs
- Wildfire 3/10 Moderate
- Heat 5/10 Major 7 d/yr ≥103°F today · 18 d/yr by 30 yrs out
- Wind 4/10 Moderate 15% chance of damaging wind over 30 yrs
- Air quality 4/10 Moderate 6 unhealthy d/yr today · 7 by 30 yrs out
Nearby sold comps map
Loading sold comps map…
Walkable amenities ~0.75 mi
Loading nearby amenities…
Taxation est. · year 1
- Rental income
- $30,777
- − Mortgage interest
- −$11,198
- − Property taxes
- −$2,998
- − Insurance
- −$1,000
- − Repairs & maintenance
- −$2,462
- − Management
- −$2,462
- − HOA
- −$3,000
- − Depreciation
- −$5,815
- Taxable income
- $1,842
- Est. tax owed @ 24.0%
- −$442
- After-tax cash flow
- $4,294/yr
For passive investors: Depreciation is non-cash, so a rental often shows a tax loss while cash-flowing — sheltering income. Rental losses are passive: they offset passive income freely, and up to $25,000/yr can offset ordinary (W-2) income if you actively participate and your MAGI is under $100k (phasing out to $0 by $150k); unused losses carry forward. On sale, claimed depreciation is recaptured at up to 25%, and gains may owe capital-gains tax (a 1031 exchange can defer both). Figures are a year-1 estimate at your 24.0% rate — not tax advice; consult a CPA.
Schools (NCES district)
- District
- Buford City
- NCES district ID
- 1300600
- Math proficiency
- 67% ▼ -8.00%
- Reading proficiency
- 61% ▼ -6.00%
- Median HH income
- $47,263
- Composite
- 54.16/100
- National rank
- #1381
- State rank
- #6 of 174 in GA
Livability — Buford
- Score
- 70/100
- State rank
- #96
- US rank
- #7638
Category grades
Schools grade is shown separately in the Schools card above.
Census & demographics
- Census place
- Buford, GA
- County
- Gwinnett County · 952,346 people
- City population
- 117,909
- Metro
- Atlanta-Sandy Springs-Alpharetta, GA
- Population (ZIP)
- 57,912
- Household income
- $96,936
- Rent vs Own
- Severe rent burden
- 1302.0
Population outlook (Gwinnett County) Hauer SSP2
- Today (2025)
- 1,106,028 people
- By 2030
- 1,211,414 · +9.5%
- By 2040
- 1,422,277 · +28.6%
- By 2050
- 1,623,204 · +46.8%
- By 2075
- 2,105,240 · +90.3%
- By 2100
- 2,443,321 · +120.9%
Race, ethnicity, and origin ACS 2023
- Neighborhood character
- Diverse neighborhood (Simpson 0.65)
- Race & ethnicity
- White 52% Hispanic / Latino 22% Two or more races 16% Black 13% Asian 9%
- Hispanic origin (detail)
- Mexican 14% Puerto Rican 2%
- Common ancestry
- Italian 3% Slovak 2% Romanian 1%
- Foreign-born
- 22% · Canada, South Korea, Vietnam
- Languages at home
- 69% English-only · Spanish 18% Korean 3% Other Indo-European 2%
Political lean MEDSL · Gwinnett
- 2024 margin
- D (+16.5) · D 57.6% · R 41.1% · Other 1.2%
- 2008→2024 swing
- +26.8pp toward D · 2008: -10.2pp · 2024: 16.5pp
- All cycles
- 2024: D+16.5 2020: D+18.3 2016: D+5.8 2012: R+9.4 2008: R+10.2
Not yet ingested
- Civics
- —
Market trends
- HPI YoY
- ▼ -133.45%
- Current HPI
- 251.5141
- Rent YoY
- ▼ -1.98%
- Metro
- Atlanta-Sandy Springs-Alpharetta, GA
- State GDP YoY
- ▲ 2.66%
- F500 in state
- 28
Industry mix (Fortune 500 HQ in GA)
| Industry | F500 HQs | Revenue |
|---|---|---|
| Paper / Packaging | 2 | $29B |
|
||
| Retail | 1 | $160B |
|
||
| Transportation / Logistics | 1 | $91B |
|
||
| Airlines | 1 | $62B |
|
||
| Consumer Goods | 1 | $47B |
|
||
| Utilities | 1 | $25B |
|
||
Price history
+273.6% since first listed2 events — show timeline
- 2026-06-05 Listed $199,900 FMLS
- 1990-08-28 Sold (Public Records) $53,500 Public Records
Property tax history
-2.1%/yrLatest (2025): $361 · +0.0% YoY. Source: county tax records.
Cash-flow waterfall
monthlySold comps — $/sqft
last 12 mo · ≤1 miLoading sold comps…