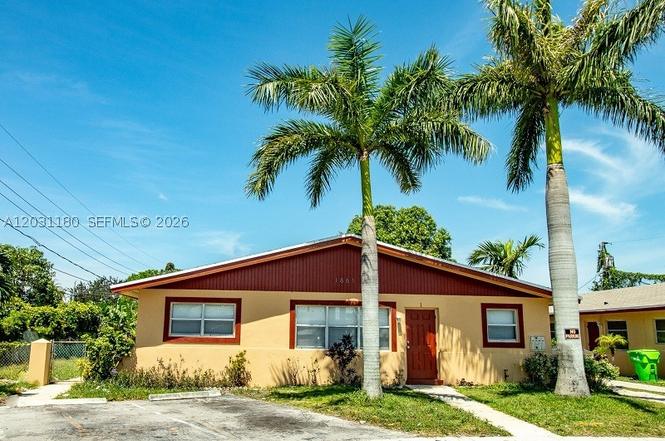
1861 NW 59th Way
Sunrise, FL 33313
$735,000D
9 bd · 3.0 ba ·
2,880 sqft ·
Built 1970
· MultiFamily
· Active
· 7 DOM
Cashflow @ list (25.0% down · 7.5%)
Estimated rent
$6,171/mo
Mortgage (P&I)
−$3,854
Tax + insurance
−$1,116
HOA
−$0
Vac / Maint / Mgmt
−$1,296
Net cashflow
$-95/mo
Annual
$-1,140/yr
Cap rate
6.14%
Cash-on-cash
-0.55%
DSCR
0.98
1% rule
0.84%
Cash to close
$205,800
Investor read
- This is a 3 × 3-bed/1.0-bath units multifamily listed at $735k.
- At list price, monthly cash flow is $-95 ($-1k/yr) — negative. Per door: $-32/mo.
- To cash-flow at today's rent, offer at most $718k (2.3% below list).
- To meet the 1% rule (rent ≥ 1% of price), the offer needs to be $617k (16.0% below list).
- Only 7 days on market — expect competitive offers; lowballing is unlikely to land.
- Recommended offer: $617k (16.0% below list) — sets the bar for 1% rule.
- Local home prices are declining (-3.0%/yr); year-one equity from $5k of loan paydown is wiped out by about $22k of value loss. Plan a longer hold.
- Location reads 83/100 on livability (#56 in FL, #986 nationally) — a professional / high-income tenant draw. Strengths: commute A+, housing A+, health & safety A+; Watch: employment C-, amenities F.
- Broward (suburban): math 42% / reading 53% proficiency, ranked #46 of 73 in FL (top 63%) — families likely to look elsewhere, expect single-tenant / working-renter base with shorter leases.
- Market conditions: Rents flat; 656 active listings in the ZIP; 2,111 units permitted in Broward County in 2024 (1,265 in 5+ unit buildings).
- Broward County population projected at +34% by 2050 — long-run rental-demand tailwind backs the buy-and-hold thesis.
- Current owner paid $565k; 30% above their basis — modest negotiation headroom, anchor on the comps not their cost.
- Climate carrying-cost: severe wind risk, 99% chance of damaging wind over 30y; extreme-heat days projected 8→29/yr by 2055 (HVAC capex compounding) — expect insurance premiums to compound above CPI over the hold.
- Cap rate 6.1% vs local median 4.9% in Sunrise — meaningfully above typical; check what's discounted (condition, days-on-market, listing class) to confirm the premium yield is real.
- At $6,171/mo this rent would consume 160% of the median local household income ($46k/yr) (locally 5692% of renters already pay >50% of income on rent) — very limited rent-growth headroom before tenants either downsize or default.
Questions for listing agent
- What do current leases actually rent for vs. the listed asking? Can we see a recent rent roll and the last 12 months of T-12 income?
- Can we see the unit-by-unit rent roll, current vacancy, and any below-market leases? What's the average tenancy length?
- What capital expenditures (roof, boiler, parking lot, exteriors) have been made in the last 5 years, and what's planned in the next 2?
- Built in 1970 — when were the roof, HVAC, electrical panel, plumbing, and water heater last replaced?
- Is there a deadline driving the sale (1031 exchange, divorce, estate, relocation)? That informs how much negotiation room exists.
- The area grade is low — what's the realistic commute time and amenity access for the typical tenant pool here? Any planned neighborhood developments (good or bad) we should know about?
- What's the average days-on-market for RENTAL listings here right now (not sales)? A rising rental-DOM trend means longer vacancies and softer asking-rent achievability than the comps imply.
- What's the recent tenant-quality profile in this submarket — average credit score on applications, eviction rate, late-payment / NSF rate, and stable-employment percentage? A property-management company in the area should have these aggregated.
CashFlowRE · CFR-C873VH4TYT6VKM
· Data 3 days ago
cashflowre.app · 2026-05-29