 Triplex
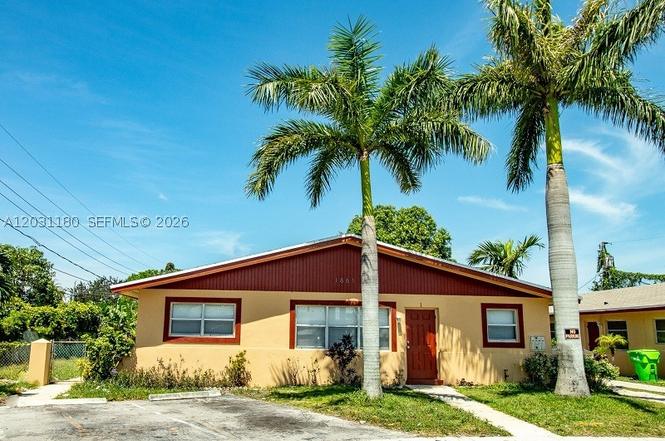
1861 NW 59th Way · Sunrise, FL
Flood risk 1/10 · Minimal
- FEMA flood zone
- X (shaded)
- Chance of flooding over 30 yrs
- 0.0%
- Est. flood insurance / yr
- $507 – $1,088
Fire risk 1/10 · Minimal
- Est. fire insurance / yr
- $947 – $1,759
Heat risk 10/10 · Severe
- Hot days now (above 105°F)
- 8 days/yr
- Hot days in 30 yrs
- 29 days/yr
Wind risk 10/10 · Severe
- Chance of severe wind over 30 yrs
- 99.0%
Air-quality risk 2/10 · Minimal
- Unhealthy air days now
- 2 days/yr
- Unhealthy air days in 30 yrs
- 2 days/yr
Risk factors via First Street. Map © Google.
Why this score? — see what drove the D grade
The composite is a weighted blend of 9 inputs, each scored 0–100. Each bar is that input's sub-score; the figure is the points it added to the 100-point composite (weight × sub-score).
- Cash flow +12.6/30.0
- ARV discount +7.5/15.0
- Livability +4.2/5.0
- Schools +4.1/10.0
- DSCR +3.8/10.0
- 1% rule +3.4/10.0
- Rent growth +2.6/5.0
- Condition / age +2.5/5.0
- Appreciation +0.0/10.0
$735,000
🖨 Deal sheet (PDF) 📄 Offer letter ✓ Due diligence
Multi-family units
County records classify this as Multi-Family (2-4 Unit). Listing-text estimate: 3 units. confirmed
Listing remarks
Excellent investment opportunity in Sunrise! This well-maintained triplex is located on a quiet cul-de-sac and features three spacious units, each offering 3 bedrooms and 1 bathroom. The property is fully occupied, providing immediate rental income for investors seeking a stable asset in a desirable location. Two units are currently leased under annual agreements, while one unit is occupied on a month-to-month basis, offering added flexibility for future ownership plans. Please note that the photos included in the listing are not recent; however, they do not reflect the current condition of the units, which remain in good condition. Do not disturb the occupants or visit the property without
Key facts
- Quiet cul-de-sac
- Desirable location
- Fully occupied
Tags
Property features AI
Finance
- Other: Property managed/listed by Truenest Property Management
- Financial info: Some units are leased; example rents shown: $1,800; $1,750; $1,700; Rent includes pest control
- HOA & community: No HOA information provided
Exterior
- Parking: Total of 6 parking spaces; Individual unit parking spaces (unit descriptions list 'Parking: Space')
- Security: No security features provided
- Utilities: Public sewer; Cable service not available
- Home design: Single-story building; Resale property; Shingle roof; Block construction
- Construction: Block construction; Shingle roof
- Exterior features: Less than quarter acre lot; Zoned RM-10
Interior
- Kitchen: No kitchen appliance details provided
- Bedrooms: Five total 3-bedroom units (3 units of one type, 2 units of another, and 1 unit of a third type) — units are unfurnished
- Flooring: Ceramic tile flooring; Vinyl flooring
- Bathrooms: Each unit has 1 full bathroom
- Heating & cooling: Central air conditioning
- Interior features: Ceramic tile and vinyl flooring
- Laundry & utility: No laundry or utility room details provided
Neighborhood map
What this means for you Summary
Snapshot
- This is a 3 × 3-bed/1.0-bath units multifamily listed at $735k.
Deal economics
- At list price, monthly cash flow is $-95 ($-1k/yr) — negative. Per door: $-32/mo.
- To cash-flow at today's rent, offer at most $718k (2.3% below list).
- To meet the 1% rule (rent ≥ 1% of price), the offer needs to be $617k (16.0% below list).
- Recommended offer: $617k (16.0% below list) — sets the bar for 1% rule.
- Cap rate 6.1% vs local median 4.9% in Sunrise — meaningfully above typical; check what's discounted (condition, days-on-market, listing class) to confirm the premium yield is real.
Location & tenants
- Location reads 83/100 on livability (#56 in FL, #986 nationally) — a professional / high-income tenant draw. Strengths: commute A+, housing A+, health & safety A+; Watch: employment C-, amenities F.
- Broward (suburban): math 42% / reading 53% proficiency, ranked #46 of 73 in FL (top 63%) — families likely to look elsewhere, expect single-tenant / working-renter base with shorter leases.
- Market conditions: Rents flat; 656 active listings in the ZIP; 2,111 units permitted in Broward County in 2024 (1,265 in 5+ unit buildings).
- At $6,171/mo this rent would consume 160% of the median local household income ($46k/yr) (locally 5692% of renters already pay >50% of income on rent) — very limited rent-growth headroom before tenants either downsize or default.
Forward outlook
- Local home prices are declining (-3.0%/yr); year-one equity from $5k of loan paydown is wiped out by about $22k of value loss. Plan a longer hold.
- Broward County population projected at +34% by 2050 — long-run rental-demand tailwind backs the buy-and-hold thesis.
Negotiation context
- Only 7 days on market — expect competitive offers; lowballing is unlikely to land.
- Current owner paid $565k; 30% above their basis — modest negotiation headroom, anchor on the comps not their cost.
Risks & watch-outs
- Climate carrying-cost: severe wind risk, 99% chance of damaging wind over 30y; extreme-heat days projected 8→29/yr by 2055 (HVAC capex compounding) — expect insurance premiums to compound above CPI over the hold.
Questions for the listing agent
- What do current leases actually rent for vs. the listed asking? Can we see a recent rent roll and the last 12 months of T-12 income?
- Can we see the unit-by-unit rent roll, current vacancy, and any below-market leases? What's the average tenancy length?
- What capital expenditures (roof, boiler, parking lot, exteriors) have been made in the last 5 years, and what's planned in the next 2?
- Built in 1970 — when were the roof, HVAC, electrical panel, plumbing, and water heater last replaced?
- Is there a deadline driving the sale (1031 exchange, divorce, estate, relocation)? That informs how much negotiation room exists.
- The area grade is low — what's the realistic commute time and amenity access for the typical tenant pool here? Any planned neighborhood developments (good or bad) we should know about?
- What's the average days-on-market for RENTAL listings here right now (not sales)? A rising rental-DOM trend means longer vacancies and softer asking-rent achievability than the comps imply.
- What's the recent tenant-quality profile in this submarket — average credit score on applications, eviction rate, late-payment / NSF rate, and stable-employment percentage? A property-management company in the area should have these aggregated.
- How much new apartment / multifamily construction is in the pipeline within 1–3 miles? Heavy new supply (>2% of stock underway) typically softens rents 12–24 months out; light construction supports rent growth.
Investment metrics
- 1% rule
- 0.84% ✗
- Cap rate
- 6.14%
- Cash-on-cash
- -0.55%
- DSCR
- 0.98
- GRM
- 9.9
CMA / ARV
No comps found within radius.
Projected returns pro-forma
-3.0% appreciation · 0.26% rent growth · sell at horizon
- IRR
- -20.3%
- Equity multiple
- 0.31×
- Total profit
- $-141,685
- Equity at exit
- $109,591
- IRR
- -20.7%
- Equity multiple
- 0.05×
- Total profit
- $-195,388
- Equity at exit
- $63,549
Cash invested: $205,800 (down + closing). Projections, not guarantees.
Landlord ↔ Tenant lean methodology
- Overall (STATE)
- 87 Strongly Landlord-Friendly
- State Florida
- 87 Strongly Landlord-Friendly · R+3
- County
- — inherits STATE
- City
- — inherits STATE
ZIP-level market 33313
- Rents YoY
- 0.3%
- Active inventory
- 656
- Price-to-rent
- 29.8×
Monthly cashflow live
- Estimated rent
- $6,171 high interval (Pro) →
- Mortgage (P&I)
- −$3,854
- Tax from tax record
- −$809 /mo · $9,713/yr
- Insurance
- −$306
- HOA
- −$0
- Vacancy / Maint / Mgmt
- −$1,296
- Net cashflow
- $-95
Break-even live
Sensitivity live
| Price | -10% $321 | -5% $113 | +0% $-95 | +5% $-303 | +10% $-511 |
|---|---|---|---|---|---|
| Rent | -10% $-582 | -5% $-339 | +0% $-95 | +5% $149 | +10% $393 |
| Rate | -1.0pp $275 | -0.5pp $92 | base $-95 | +0.5pp $-285 | +1.0pp $-479 |
3-unit breakdown (identical units grouped — click to expand)
| Units | Beds | Baths | Est. rent |
|---|---|---|---|
| 3× units | 3 | 1 | $6,171 |
| #1 | 3 | 1 | $2,057 |
| #2 | 3 | 1 | $2,057 |
| #3 | 3 | 1 | $2,057 |
| Total (3 units) | $6,171 | ||
UW: 25.0% down · 7.5% · 30yr · 1.5% tax · 5.0% vac · 8.0% maint · 8.0% mgmt
Financing live
Cash to close
- Down payment
- $183,750
- Closing costs
- $22,050
- Reserves months
- —
- Total cash needed
- —
Loan-product check · same deal, 3 products live
Conventional
25% down · 7.5% · 30yr
- Down + closing
- —
- Monthly P&I
- —
- Monthly cashflow
- —
- DSCR
- —
- Eligible?
- —
Personal DTI + credit; lowest rate.
DSCR
20% down · 8.5% · 30yr
- Down + closing
- —
- Monthly P&I
- —
- Monthly cashflow
- —
- DSCR
- —
- Eligible?
- —
No personal income docs; deal must DSCR.
Hard money
10% down · 12.0% · 12mo
- Down + closing
- —
- Monthly P&I
- —
- Monthly cashflow
- —
- DSCR
- —
- Eligible?
- —
Short-term bridge; refi at stabilization.
Listing history 6 events
-
2026-06-18days on market $735,000 Active 7 DOM
-
2026-06-17days on market $735,000 Active 6 DOM
-
2026-06-16days on market $735,000 Active 5 DOM
-
2026-06-15days on market $735,000 Active 4 DOM
-
2026-06-13remarks 699-char remark
-
2026-06-13$735,000 Active 2 DOM
ⓘ Source: listings_history table (triggers on properties + properties_extension) + one-shot
backfill from property_details.listing_events for pre-trigger history.
Tax reassessment forecast FL · Resets to sale price
- Current annual tax
- $9,713 · $809/mo
- Projected year-2 tax
- $9,713 · $809/mo
- Expected delta
- $0/yr ($0/mo · 0.0%)
ⓘ Screening estimate from a state-policy table — verify with the county assessor before closing.
Climate risk First Street
- Flood 1/10 Low FEMA zone X (shaded) · 0% chance over 30 yrs
- Wildfire 1/10 Low
- Heat 10/10 Extreme 8 d/yr ≥105°F today · 29 d/yr by 30 yrs out
- Wind 10/10 Extreme 99% chance of damaging wind over 30 yrs
- Air quality 2/10 Low 2 unhealthy d/yr today · 2 by 30 yrs out
Nearby sold comps map
Loading sold comps map…
Walkable amenities ~0.75 mi
Loading nearby amenities…
Taxation est. · year 1
- Rental income
- $74,052
- − Mortgage interest
- −$41,171
- − Property taxes
- −$9,713
- − Insurance
- −$3,675
- − Repairs & maintenance
- −$5,924
- − Management
- −$5,924
- − Depreciation
- −$21,382
- Taxable loss
- −$13,737
- Est. tax savings @ 24.0%
- +$3,297
- After-tax cash flow
- $2,157/yr
For passive investors: Depreciation is non-cash, so a rental often shows a tax loss while cash-flowing — sheltering income. Rental losses are passive: they offset passive income freely, and up to $25,000/yr can offset ordinary (W-2) income if you actively participate and your MAGI is under $100k (phasing out to $0 by $150k); unused losses carry forward. On sale, claimed depreciation is recaptured at up to 25%, and gains may owe capital-gains tax (a 1031 exchange can defer both). Figures are a year-1 estimate at your 24.0% rate — not tax advice; consult a CPA.
Schools (NCES district)
- District
- Broward
- NCES district ID
- 1200180
- Math proficiency
- 42% ▼ -18.00%
- Reading proficiency
- 53% ▼ -5.00%
- Median HH income
- $52,139
- Composite
- 40.88/100
- National rank
- #3621
- State rank
- #46 of 73 in FL
Livability — Sunrise
- Score
- 83/100
- State rank
- #56
- US rank
- #986
Category grades
Schools grade is shown separately in the Schools card above.
Census & demographics
- Census place
- Sunrise, FL
- County
- Broward County · 1,963,430 people
- Metro
- Miami-Fort Lauderdale-Pompano Beach, FL
- Population (ZIP)
- 62,807
- Household income
- $46,305
- Rent vs Own
- Severe rent burden
- 5692.0
Population outlook (Broward County) Hauer SSP2
- Today (2025)
- 2,207,033 people
- By 2030
- 2,360,704 · +7.0%
- By 2040
- 2,661,208 · +20.6%
- By 2050
- 2,946,698 · +33.5%
- By 2075
- 3,602,273 · +63.2%
- By 2100
- 3,970,984 · +79.9%
Race, ethnicity, and origin ACS 2023
- Neighborhood character
- Predominantly Black (77%)
- Race & ethnicity
- Black 77% Hispanic / Latino 12% Two or more races 8% White 7% Asian 2%
- Hispanic origin (detail)
- Puerto Rican 2% Cuban 3% Dominican 1%
- Common ancestry
- Hispanic 20%
- Foreign-born
- 39% · Canada, Jamaica, Dominican Republic
- Languages at home
- 66% English-only · French/Haitian/Cajun 22% Spanish 10%
Political lean MEDSL · Broward
- 2024 margin
- D (+17.0) · D 58.0% · R 41.0%
- 2008→2024 swing
- -17.8pp toward R · 2008: 34.7pp · 2024: 17.0pp
- All cycles
- 2024: D+17.0 2020: D+29.8 2016: D+35.0 2012: D+34.9 2008: D+34.7
Not yet ingested
- Civics
- —
Market trends
- HPI YoY
- ▼ -338.15%
- Current HPI
- 288.9345
- Rent YoY
- ▲ 0.26%
- Metro
- Miami-Fort Lauderdale-Pompano Beach, FL
- State GDP YoY
- ▲ 3.28%
- F500 in state
- 36
Industry mix (Fortune 500 HQ in FL)
| Industry | F500 HQs | Revenue |
|---|---|---|
| Industrial Technology | 2 | $29B |
|
||
| Insurance | 2 | $17B |
|
||
| Retail | 1 | $60B |
|
||
| Technology Distribution | 1 | $58B |
|
||
| Homebuilding | 1 | $35B |
|
||
| Technology Manufacturing | 1 | $35B |
|
||
Price history
+1370.0% since first listed5 events — show timeline
- 2026-06-11 Listed $735,000 MARMLS
- 2018-08-09 Sold (Public Records) $565,000 Public Records
- 2017-11-08 Sold (Public Records) $325,000 Public Records
- 1984-08-01 Sold (Public Records) $95,000 Public Records
- 1971-08-01 Sold (Public Records) $50,000 Public Records
Property tax history
+10.6%/yrLatest (2025): $9,713 · +10.7% YoY. Source: county tax records.
Cash-flow waterfall
monthlySold comps — $/sqft
last 12 mo · ≤1 miLoading sold comps…