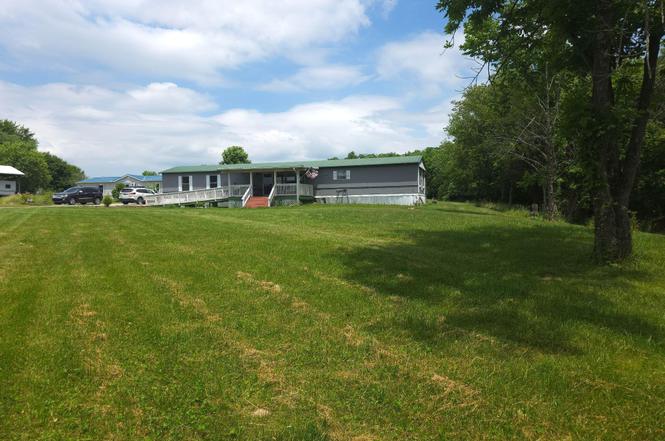
9971 Greathouse Rd
Winchester, OH 45697
$129,999D+
3 bd · 2.0 ba ·
1,216 sqft ·
Built 2000
· Land
· Active
· 1 DOM
Cashflow @ list (25.0% down · 7.5%)
Estimated rent
$1,093/mo
Mortgage (P&I)
−$682
Tax + insurance
−$217
HOA
−$0
Vac / Maint / Mgmt
−$230
Net cashflow
$-35/mo
Annual
$-416/yr
Cap rate
5.97%
Cash-on-cash
-1.14%
DSCR
0.95
1% rule
0.84%
Cash to close
$36,400
Investor read
- This is a 3-bed/2.0-bath land listed at $130k.
- At list price, monthly cash flow is $-35 ($-416/yr) — negative.
- To cash-flow at today's rent, offer at most $125k (3.9% below list).
- To meet the 1% rule (rent ≥ 1% of price), the offer needs to be $109k (15.9% below list).
- Only 1 days on market — expect competitive offers; lowballing is unlikely to land.
- Recommended offer: $109k (15.9% below list) — sets the bar for 1% rule.
- In year one you build about $14k of equity ($899 loan paydown + $13k appreciation (10.0% local appreciation)).
- Location reads 74/100 on livability (#289 in OH, #4,753 nationally) — a middle-class / working-renter tenant base. Strengths: crime A+, cost of living A+, housing A+; Watch: schools C-, amenities F, commute F.
- Eastern Local (rural): math 51% / reading 61% proficiency, ranked #350 of 656 in OH (top 53%) — acceptable for families but not a draw, mixed tenant base, ~2y average lease.
- Market conditions: 16 active listings in the ZIP; solid renter incomes; 147 units permitted in Brown County in 2024 (0 in 5+ unit buildings).
- Brown County population projected at -26% by 2050 — secular population decline; favor cash flow + early exit over multi-decade hold.
- 3 sale attempts since 6y ago with the ask held roughly flat each time — persistent listings suggest the price (not the market) is what's stuck; bring a comps-based counter.
- Current owner paid $59k; list at $130k implies a 120% gain — meaningful room to come down on a strong offer.
- At projected returns (10.0% appreciation + 3.0% rent growth), your $36k cash investment doubles in ~3 years — after that, you're playing with house money.
- By year 3, paydown + projected appreciation supports a ~$35k cash-out refi (75% LTV) — recoverable capital for the next deal without selling this one.
- This rent is only 17% of the median local income ($75k/yr) — well below the 30% rent-burden line; pricing power to push rent on renewal without tenant pushback.
Questions for listing agent
- What do current leases actually rent for vs. the listed asking? Can we see a recent rent roll and the last 12 months of T-12 income?
- Is there a deadline driving the sale (1031 exchange, divorce, estate, relocation)? That informs how much negotiation room exists.
- The area grade is low — what's the realistic commute time and amenity access for the typical tenant pool here? Any planned neighborhood developments (good or bad) we should know about?
- What's the average days-on-market for RENTAL listings here right now (not sales)? A rising rental-DOM trend means longer vacancies and softer asking-rent achievability than the comps imply.
- What's the recent tenant-quality profile in this submarket — average credit score on applications, eviction rate, late-payment / NSF rate, and stable-employment percentage? A property-management company in the area should have these aggregated.
- How much new for-sale + rental construction is in the pipeline within 1–3 miles? Heavy new supply typically softens prices + rents 12–24 months out; constrained supply supports both.
CashFlowRE · CFR-C8MD75CEKFGCBF
· Data 2 days ago
cashflowre.app · 2026-05-29