9971 Greathouse Rd · Winchester, OH
Flood risk 1/10 · Minimal
- FEMA flood zone
- X (unshaded)
- Chance of flooding over 30 yrs
- 0.0%
- Est. flood insurance / yr
- $507 – $1,088
Fire risk 1/10 · Minimal
- Est. fire insurance / yr
- $713 – $1,323
Heat risk 4/10 · Minor
- Hot days now (above 99°F)
- 7 days/yr
- Hot days in 30 yrs
- 19 days/yr
Wind risk 2/10 · Minimal
- Chance of severe wind over 30 yrs
- 2.0%
Air-quality risk 2/10 · Minimal
- Unhealthy air days now
- 0 days/yr
- Unhealthy air days in 30 yrs
- 1 days/yr
Risk factors via First Street. Map © Google.
Why this score? — see what drove the D+ grade
The composite is a weighted blend of 9 inputs, each scored 0–100. Each bar is that input's sub-score; the figure is the points it added to the 100-point composite (weight × sub-score).
- Cash flow +11.8/30.0
- Appreciation +10.0/10.0
- ARV discount +7.5/15.0
- Schools +4.8/10.0
- Livability +3.7/5.0
- DSCR +3.5/10.0
- 1% rule +3.4/10.0
- Rent growth +2.5/5.0
- Condition / age +2.5/5.0
$129,999
🖨 Deal sheet 📄 Offer letter ✓ Due diligence
Listing remarks MLS
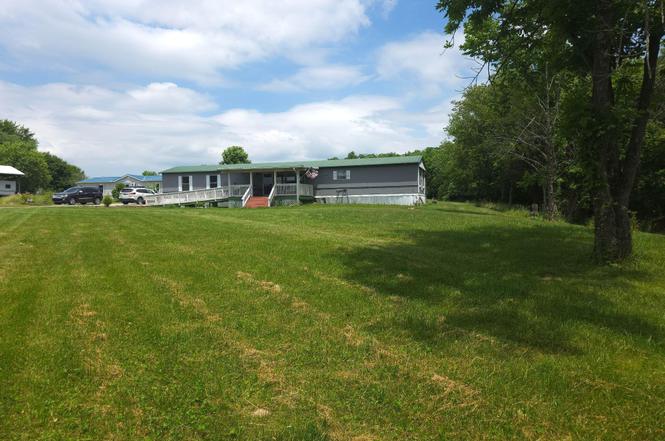
Land with all the things needed to build your dream home in a country setting. 3.2 acres with electric, water, storage shed, and septic tank. Don't want to build? One single wide trailer comes on the property with 3bd and 2ba.
Key facts
- Covered porch
- 3.2 acres
- Carport
Tags
Property features AI
Exterior
- Parking: One carport space
- Utilities: Public water; Private sewer
- Home design: Single-family residence; One-level home; Built in 2000; No shared/common walls
- Construction: Foundation: Other
- Exterior features: Approximately 3.2-acre lot
Interior
- Bedrooms: Three main-level bedrooms
- Flooring: Vinyl flooring
- Bathrooms: Two full bathrooms
- Heating & cooling: Heat pump and propane heating; Central air conditioning
- Interior features: Insulated windows throughout; Living area of 1216
Neighborhood map
What this means for you Summary
Snapshot
- This is a 3-bed/2.0-bath land listed at $130k.
Deal economics
- At list price, monthly cash flow is $-35 ($-416/yr) — negative.
- To cash-flow at today's rent, offer at most $125k (3.9% below list).
- To meet the 1% rule (rent ≥ 1% of price), the offer needs to be $109k (15.9% below list).
- Recommended offer: $109k (15.9% below list) — sets the bar for 1% rule.
Location & tenants
- Location reads 74/100 on livability (#289 in OH, #4,753 nationally) — a middle-class / working-renter tenant base. Strengths: crime A+, cost of living A+, housing A+; Watch: schools C-, amenities F, commute F.
- Eastern Local (rural): math 51% / reading 61% proficiency, ranked #350 of 656 in OH (top 53%) — acceptable for families but not a draw, mixed tenant base, ~2y average lease.
- Market conditions: 16 active listings in the ZIP; solid renter incomes; 147 units permitted in Brown County in 2024 (0 in 5+ unit buildings).
- This rent is only 17% of the median local income ($75k/yr) — well below the 30% rent-burden line; pricing power to push rent on renewal without tenant pushback.
Forward outlook
- In year one you build about $14k of equity ($899 loan paydown + $13k appreciation (10.0% local appreciation)).
- Brown County population projected at -26% by 2050 — secular population decline; favor cash flow + early exit over multi-decade hold.
- At projected returns (10.0% appreciation + 3.0% rent growth), your $36k cash investment doubles in ~3 years — after that, you're playing with house money.
- By year 3, paydown + projected appreciation supports a ~$35k cash-out refi (75% LTV) — recoverable capital for the next deal without selling this one.
Negotiation context
- Only 1 days on market — expect competitive offers; lowballing is unlikely to land.
- 3 sale attempts since 6y ago with the ask held roughly flat each time — persistent listings suggest the price (not the market) is what's stuck; bring a comps-based counter.
- Current owner paid $59k; list at $130k implies a 120% gain — meaningful room to come down on a strong offer.
Questions for the listing agent
- What do current leases actually rent for vs. the listed asking? Can we see a recent rent roll and the last 12 months of T-12 income?
- Is there a deadline driving the sale (1031 exchange, divorce, estate, relocation)? That informs how much negotiation room exists.
- The area grade is low — what's the realistic commute time and amenity access for the typical tenant pool here? Any planned neighborhood developments (good or bad) we should know about?
- What's the average days-on-market for RENTAL listings here right now (not sales)? A rising rental-DOM trend means longer vacancies and softer asking-rent achievability than the comps imply.
- What's the recent tenant-quality profile in this submarket — average credit score on applications, eviction rate, late-payment / NSF rate, and stable-employment percentage? A property-management company in the area should have these aggregated.
- How much new for-sale + rental construction is in the pipeline within 1–3 miles? Heavy new supply typically softens prices + rents 12–24 months out; constrained supply supports both.
Investment metrics
- 1% rule
- 0.84% ✗
- Cap rate
- 5.97%
- Cash-on-cash
- -1.14%
- DSCR
- 0.95
- GRM
- 9.9
CMA / ARV
No comps found within radius.
Projected returns pro-forma
10.0% appreciation · 3.0% rent growth · sell at horizon
- IRR
- 23.5%
- Equity multiple
- 2.88×
- Total profit
- $68,609
- Equity at exit
- $117,113
- IRR
- 20.9%
- Equity multiple
- 6.60×
- Total profit
- $203,811
- Equity at exit
- $252,559
Cash invested: $36,400 (down + closing). Projections, not guarantees.
Landlord ↔ Tenant lean methodology
- Overall (STATE)
- 73 Landlord-Friendly
- State Ohio
- 73 Landlord-Friendly · R+6
- County
- — inherits STATE
- City
- — inherits STATE
ZIP-level market 45697
- Home prices YoY
- 9.1%
- Active inventory
- 16
- Price-to-rent
- 9.9×
Monthly cashflow live
- Estimated rent
- $1,093 medium interval (Pro) →
- Mortgage (P&I)
- −$682
- Tax est. 1.5%
- −$162 /mo · $1,950/yr
- Insurance
- −$54
- HOA
- −$0
- Vacancy / Maint / Mgmt
- −$230
- Net cashflow
- $-35
Break-even live
UW: 25.0% down · 7.5% · 30yr · 1.5% tax · 5.0% vac · 8.0% maint · 8.0% mgmt
Financing live
Cash to close
- Down payment
- $32,500
- Closing costs
- $3,900
- Reserves months
- —
- Total cash needed
- —
Loan-product check · same deal, 3 products live
Conventional
25% down · 7.5% · 30yr
- Down + closing
- —
- Monthly P&I
- —
- Monthly cashflow
- —
- DSCR
- —
- Eligible?
- —
Personal DTI + credit; lowest rate.
DSCR
20% down · 8.5% · 30yr
- Down + closing
- —
- Monthly P&I
- —
- Monthly cashflow
- —
- DSCR
- —
- Eligible?
- —
No personal income docs; deal must DSCR.
Hard money
10% down · 12.0% · 12mo
- Down + closing
- —
- Monthly P&I
- —
- Monthly cashflow
- —
- DSCR
- —
- Eligible?
- —
Short-term bridge; refi at stabilization.
Listing history 2 events
-
2026-06-18remarks 486-char remark
-
2026-06-18$129,999 Active 1 DOM
ⓘ Source: listings_history table (triggers on properties + properties_extension) + one-shot
backfill from property_details.listing_events for pre-trigger history.
Climate risk First Street
- Flood 1/10 Low FEMA zone X (unshaded) · 0% chance over 30 yrs
- Wildfire 1/10 Low
- Heat 4/10 Moderate 7 d/yr ≥99°F today · 19 d/yr by 30 yrs out
- Wind 2/10 Low 2% chance of damaging wind over 30 yrs
- Air quality 2/10 Low 0 unhealthy d/yr today · 1 by 30 yrs out
Nearby sold comps map
Loading sold comps map…
Walkable amenities ~0.75 mi
Loading nearby amenities…
Taxation est. · year 1
- Rental income
- $13,120
- − Mortgage interest
- −$7,282
- − Property taxes
- −$1,950
- − Insurance
- −$650
- − Repairs & maintenance
- −$1,050
- − Management
- −$1,050
- − Depreciation
- −$3,782
- Taxable loss
- −$2,643
- Est. tax savings @ 24.0%
- +$634
- After-tax cash flow
- $218/yr
For passive investors: Depreciation is non-cash, so a rental often shows a tax loss while cash-flowing — sheltering income. Rental losses are passive: they offset passive income freely, and up to $25,000/yr can offset ordinary (W-2) income if you actively participate and your MAGI is under $100k (phasing out to $0 by $150k); unused losses carry forward. On sale, claimed depreciation is recaptured at up to 25%, and gains may owe capital-gains tax (a 1031 exchange can defer both). Figures are a year-1 estimate at your 24.0% rate — not tax advice; consult a CPA.
Schools (NCES district)
- District
- Eastern Local
- NCES district ID
- 3904603
- Math proficiency
- 51% ▼ -9.00%
- Reading proficiency
- 61% ▼ -8.00%
- Median HH income
- $50,895
- Composite
- 47.81/100
- National rank
- #2226
- State rank
- #350 of 656 in OH
Livability — Winchester
- Score
- 74/100
- State rank
- #289
- US rank
- #4753
Category grades
Schools grade is shown separately in the Schools card above.
Census & demographics
- County
- Adams · 32,832 people
- Population (ZIP)
- 6,138
- Household income
- $75,075
- Rent vs Own
Population outlook (Brown County) Hauer SSP2
- Today (2025)
- 41,243 people
- By 2030
- 39,382 · -4.5%
- By 2040
- 35,196 · -14.7%
- By 2050
- 30,743 · -25.5%
- By 2075
- 21,870 · -47.0%
- By 2100
- 15,069 · -63.5%
Race, ethnicity, and origin ACS 2023
- Neighborhood character
- Predominantly White (96%)
- Race & ethnicity
- White 96% Two or more races 2% Hispanic / Latino 1%
- Common ancestry
- Lithuanian 8% Serbian 3% Italian 1%
- Foreign-born
- 2% · Canada
- Languages at home
- 97% English-only · German/W. Germanic 2% Other Indo-European 1%
Political lean MEDSL · Brown
- 2024 margin
- Solid R (+61.5) · D 19.0% · R 80.5%
- 2008→2024 swing
- -38.2pp toward R · 2008: -23.3pp · 2024: -61.5pp
- All cycles
- 2024: R+61.5 2020: R+57.4 2016: R+52.2 2012: R+25.1 2008: R+23.3
Not yet ingested
- Civics
- —
Market trends
- HPI YoY
- ▲ 24.08%
- Current HPI
- 289.3931
- Rent YoY
- —
- Metro
- —
- State GDP YoY
- ▲ 1.98%
- F500 in state
- 48
Industry mix (Fortune 500 HQ in OH)
| Industry | F500 HQs | Revenue |
|---|---|---|
| Insurance | 3 | $145B |
|
||
| Industrial Machinery | 3 | $49B |
|
||
| Financial Services | 3 | $24B |
|
||
| Consumer Goods | 2 | $93B |
|
||
| Aerospace / Defense | 2 | $47B |
|
||
| Utilities | 2 | $33B |
|
||
Price history
+120.3% since first listed6 events — show timeline
- 2026-06-17 Listed $129,999 CBRMLS
- 2020-11-20 Sold (MLS) $59,000 Cincy MLS
- 2020-10-15 Contingent — Cincy MLS
- 2020-10-14 Relisted — Cincy MLS
- 2020-10-12 Contingent — Cincy MLS
- 2020-10-07 Listed $59,000 Cincy MLS
Cash-flow waterfall
monthlySold comps — $/sqft
last 12 mo · ≤1 miLoading sold comps…