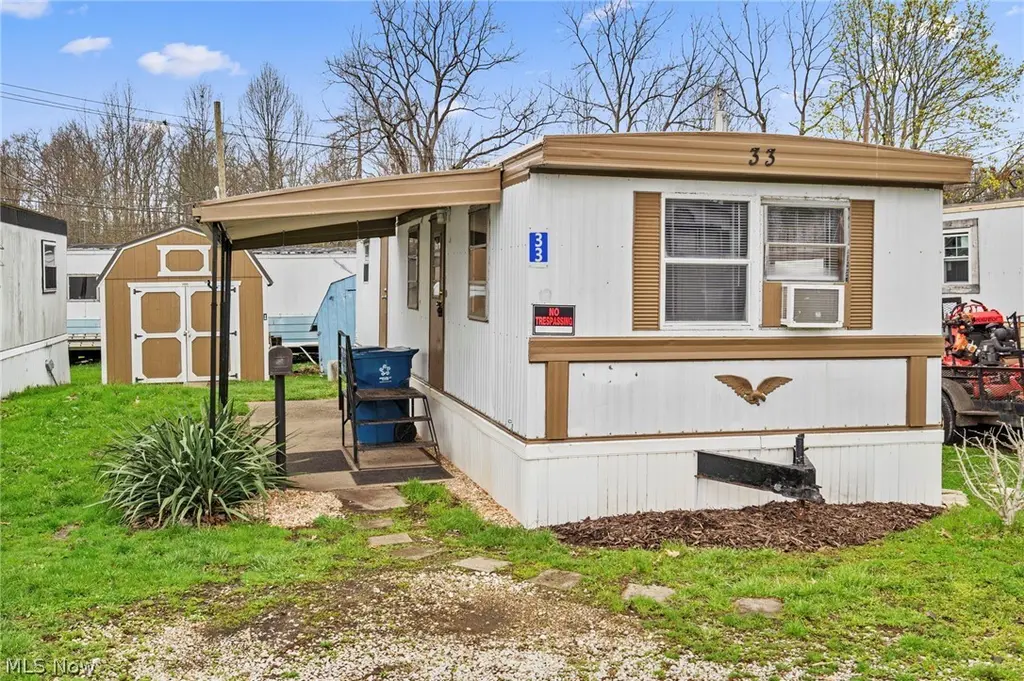
3354 Hilton St NW #33
Perry Heights, OH 44646
$24,000C
1 bd · 1.0 ba ·
900 sqft ·
Built 1970
· Manufactured
· Active
· 1 DOM
Cashflow @ list (25.0% down · 7.5%)
Estimated rent
$921/mo
Mortgage (P&I)
−$126
Tax + insurance
−$40
HOA
−$540
Vac / Maint / Mgmt
−$193
Net cashflow
$22/mo
Annual
$258/yr
Cap rate
7.37%
Cash-on-cash
3.84%
DSCR
1.17
1% rule
3.84%
Cash to close
$6,720
Investor read
- This is a 1-bed/1.0-bath manufactured listed at $24k.
- At list price, monthly cash flow is $22 ($258/yr) — positive.
- The deal already cash-flows at list — no discount required.
- Meets the 1% rule at list price ($921 rent vs $24k).
- Only 1 days on market — expect competitive offers; lowballing is unlikely to land.
- Local home prices are declining (-3.0%/yr); year-one equity from $166 of loan paydown is wiped out by about $720 of value loss. Plan a longer hold.
- Location reads 68/100 on livability (#575 in OH) — a middle-class / working-renter tenant base. Strengths: cost of living A+, housing A+; Watch: schools C-, amenities F, commute F.
- Perry Local (suburban): math 63% / reading 73% proficiency, ranked #173 of 656 in OH (top 26%) — acceptable for families but not a draw, mixed tenant base, ~2y average lease.
- Watch-outs: HOA is 59% of rent.
- Market conditions: Rents rising fast (+6.0%/yr); 208 active listings in the ZIP; 5 comparable units currently listed for rent nearby; rentals at typical pace (median 21d on market — plan ~3-4 weeks tenant-placement turnaround); 528 units permitted in Stark County in 2024 (84 in 5+ unit buildings).
- Stark County population projected to shrink 8% by 2050 — rents likely to lag national; underwrite the cash flow, not the appreciation.
- 4 sale attempts since 9y ago; this cycle's ask has dropped $6k (20%) from the opening price — seller is motivated, your offer sets the floor, not the list.
- Current owner paid $20k; 20% above their basis — modest negotiation headroom, anchor on the comps not their cost.
- At projected returns (-3.0% appreciation + 6.0% rent growth), your $7k cash investment doubles in ~7 years — after that, you're playing with house money.
- Cap rate 7.4% vs local median 2.7% in Perry Heights — top-decile yield for the area; either an underpriced asset or a hidden risk that comps aren't pricing in. Stress-test before assuming the spread holds.
- This rent is only 16% of the median local income ($69k/yr) — well below the 30% rent-burden line; pricing power to push rent on renewal without tenant pushback.
Questions for listing agent
- Built in 1970 — when were the roof, HVAC, electrical panel, plumbing, and water heater last replaced?
- What does the HOA fee cover, when was the last increase, and are there any pending special assessments or reserve-fund shortfalls?
- Is there a deadline driving the sale (1031 exchange, divorce, estate, relocation)? That informs how much negotiation room exists.
- What's the average days-on-market for RENTAL listings here right now (not sales)? A rising rental-DOM trend means longer vacancies and softer asking-rent achievability than the comps imply.
- What's the recent tenant-quality profile in this submarket — average credit score on applications, eviction rate, late-payment / NSF rate, and stable-employment percentage? A property-management company in the area should have these aggregated.
- How much new for-sale + rental construction is in the pipeline within 1–3 miles? Heavy new supply typically softens prices + rents 12–24 months out; constrained supply supports both.
CashFlowRE · CFR-C8RY3Y10T4DSZB
· Data 2 days ago
cashflowre.app · 2026-05-29