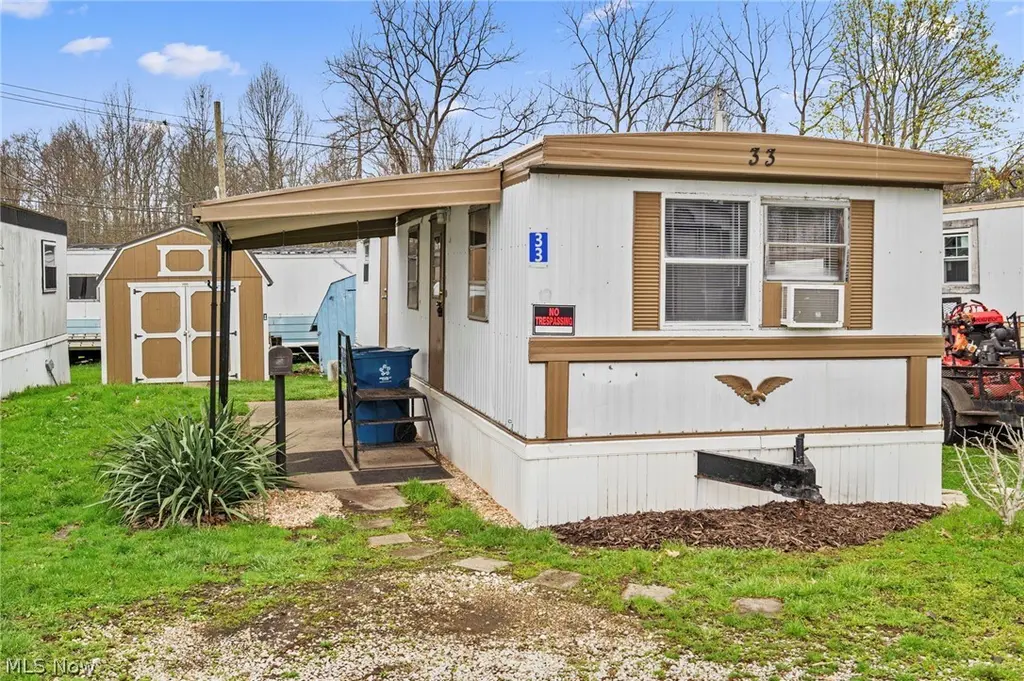
3354 Hilton St NW #33 · Perry Heights, OH
Flood risk 1/10 · Minimal
- FEMA flood zone
- X (unshaded)
- Chance of flooding over 30 yrs
- 0.0%
- Est. flood insurance / yr
- $507 – $1,088
Fire risk 1/10 · Minimal
- Est. fire insurance / yr
- $713 – $1,323
Heat risk 3/10 · Minor
- Hot days now (above 96°F)
- 6 days/yr
- Hot days in 30 yrs
- 15 days/yr
Wind risk 1/10 · Minimal
- Chance of severe wind over 30 yrs
- —
Air-quality risk 2/10 · Minimal
- Unhealthy air days now
- 0 days/yr
- Unhealthy air days in 30 yrs
- 1 days/yr
Risk factors via First Street. Map © Google.
Why this score? — see what drove the C grade
The composite is a weighted blend of 9 inputs, each scored 0–100. Each bar is that input's sub-score; the figure is the points it added to the 100-point composite (weight × sub-score).
- Cash flow +18.2/30.0
- 1% rule +10.0/10.0
- ARV discount +7.5/15.0
- Schools +5.8/10.0
- DSCR +5.7/10.0
- Rent growth +4.0/5.0
- Livability +3.4/5.0
- Condition / age +2.5/5.0
- Appreciation +0.0/10.0
$24,000
🖨 Deal sheet 📄 Offer letter ✓ Due diligence
Listing remarks MLS
Looking to downsize? This Perry Township mobile home that has been recently updated throughout. Enjoy cooking in the kitchen that offers new kitchen cabinets with plenty of storage & appliances included. Relax in the living room that has new carpet & has been freshly painted. Throughout the hall way, kitchen & living room there has been new drywall installed prior to painting. New flooring throughout the entire mobile home has just been installed. Enjoy the updated bathroom that has a newer shower & toilet. Organize your personal belongings in the bedroom that has a new closet organizer. The seller has made an area to have a washer/dryer hookup & are included with the purchase. Electric & plumbing have been updated. The roof was recently coated. Utilize the shed that comes with the property, great for outside storage. Enjoy your morning coffee on the front covered patio. Everything has been done, so you can move in, unpack & enjoy making this your home sweet home.
Key facts
- Fresh paint
- New backsplash
- Brand new carpeting
Tags
Property features AI
Finance
- Financial info: Property has a land lease with a monthly amount of $540
- HOA & community: Part of Trailwind Massillon homeowners association; Monthly HOA fee of $540; HOA covers association management, sewer, and trash
Exterior
- Parking: Unpaved parking
- Utilities: Public water; Public sewer
- Home design: Single-story unit; Flat roof
- Construction: Built per public records; Vinyl siding construction; Flat roof
- Exterior features: Vinyl siding; On-site storage
Interior
- Kitchen: Range; Refrigerator; Dishwasher
- Bedrooms: One main-level bedroom
- Bathrooms: One full main-level bathroom
- Heating & cooling: Electric forced-air heating; Wall-mounted cooling unit
- Interior features: Storage space
- Laundry & utility: Washer; Dryer
Neighborhood map
What this means for you Summary
Snapshot
- This is a 1-bed/1.0-bath manufactured listed at $24k.
Deal economics
- At list price, monthly cash flow is $22 ($258/yr) — positive.
- The deal already cash-flows at list — no discount required.
- Meets the 1% rule at list price ($921 rent vs $24k).
- Cap rate 7.4% vs local median 2.7% in Perry Heights — top-decile yield for the area; either an underpriced asset or a hidden risk that comps aren't pricing in. Stress-test before assuming the spread holds.
Location & tenants
- Location reads 68/100 on livability (#575 in OH) — a middle-class / working-renter tenant base. Strengths: cost of living A+, housing A+; Watch: schools C-, amenities F, commute F.
- Perry Local (suburban): math 63% / reading 73% proficiency, ranked #173 of 656 in OH (top 26%) — acceptable for families but not a draw, mixed tenant base, ~2y average lease.
- Market conditions: Rents rising fast (+6.0%/yr); 208 active listings in the ZIP; 5 comparable units currently listed for rent nearby; rentals at typical pace (median 21d on market — plan ~3-4 weeks tenant-placement turnaround); 528 units permitted in Stark County in 2024 (84 in 5+ unit buildings).
- This rent is only 16% of the median local income ($69k/yr) — well below the 30% rent-burden line; pricing power to push rent on renewal without tenant pushback.
Forward outlook
- Local home prices are declining (-3.0%/yr); year-one equity from $166 of loan paydown is wiped out by about $720 of value loss. Plan a longer hold.
- Stark County population projected to shrink 8% by 2050 — rents likely to lag national; underwrite the cash flow, not the appreciation.
- At projected returns (-3.0% appreciation + 6.0% rent growth), your $7k cash investment doubles in ~7 years — after that, you're playing with house money.
Negotiation context
- Only 1 days on market — expect competitive offers; lowballing is unlikely to land.
- 4 sale attempts since 9y ago; this cycle's ask has dropped $6k (20%) from the opening price — seller is motivated, your offer sets the floor, not the list.
- Current owner paid $20k; 20% above their basis — modest negotiation headroom, anchor on the comps not their cost.
Risks & watch-outs
- Watch-outs: HOA is 59% of rent.
Questions for the listing agent
- Built in 1970 — when were the roof, HVAC, electrical panel, plumbing, and water heater last replaced?
- What does the HOA fee cover, when was the last increase, and are there any pending special assessments or reserve-fund shortfalls?
- Is there a deadline driving the sale (1031 exchange, divorce, estate, relocation)? That informs how much negotiation room exists.
- What's the average days-on-market for RENTAL listings here right now (not sales)? A rising rental-DOM trend means longer vacancies and softer asking-rent achievability than the comps imply.
- What's the recent tenant-quality profile in this submarket — average credit score on applications, eviction rate, late-payment / NSF rate, and stable-employment percentage? A property-management company in the area should have these aggregated.
- How much new for-sale + rental construction is in the pipeline within 1–3 miles? Heavy new supply typically softens prices + rents 12–24 months out; constrained supply supports both.
Investment metrics
- 1% rule
- 3.84% ✓
- Cap rate
- 7.37%
- Cash-on-cash
- 3.84%
- DSCR
- 1.17
- GRM
- 2.2
CMA / ARV
No comps found within radius.
Projected returns pro-forma
-3.0% appreciation · 6.04% rent growth · sell at horizon
- IRR
- 2.5%
- Equity multiple
- 1.11×
- Total profit
- $730
- Equity at exit
- $3,578
- IRR
- 19.8%
- Equity multiple
- 3.45×
- Total profit
- $16,481
- Equity at exit
- $2,075
Cash invested: $6,720 (down + closing). Projections, not guarantees.
Landlord ↔ Tenant lean methodology
- Overall (STATE)
- 73 Landlord-Friendly
- State Ohio
- 73 Landlord-Friendly · R+6
- County
- — inherits STATE
- City
- — inherits STATE
ZIP-level market 44646
- Rents YoY
- 6.0%
- Active inventory
- 208
- Price-to-rent
- 2.2×
Monthly cashflow live
- Estimated rent
- $921 high interval (Pro) →
- Mortgage (P&I)
- −$126
- Tax est. 1.5%
- −$30 /mo · $360/yr
- Insurance
- −$10
- HOA
- −$540
- Vacancy / Maint / Mgmt
- −$193
- Net cashflow
- $22
Break-even live
UW: 25.0% down · 7.5% · 30yr · 1.5% tax · 5.0% vac · 8.0% maint · 8.0% mgmt
Financing live
Cash to close
- Down payment
- $6,000
- Closing costs
- $720
- Reserves months
- —
- Total cash needed
- —
Loan-product check · same deal, 3 products live
Conventional
25% down · 7.5% · 30yr
- Down + closing
- —
- Monthly P&I
- —
- Monthly cashflow
- —
- DSCR
- —
- Eligible?
- —
Personal DTI + credit; lowest rate.
DSCR
20% down · 8.5% · 30yr
- Down + closing
- —
- Monthly P&I
- —
- Monthly cashflow
- —
- DSCR
- —
- Eligible?
- —
No personal income docs; deal must DSCR.
Hard money
10% down · 12.0% · 12mo
- Down + closing
- —
- Monthly P&I
- —
- Monthly cashflow
- —
- DSCR
- —
- Eligible?
- —
Short-term bridge; refi at stabilization.
Rent comps 5 comps
| Address | Beds | Baths | Sqft | Rent | $/sqft | DOM | Units | Dist |
|---|---|---|---|---|---|---|---|---|
| 2851 Lincoln Way E Massillon, OH | 1.0–2.0 | 1.0–2.0 | 875 | $800 | $0.91 | 13d | 1 | 0.68mi |
| 182 Bernower Ave SW Massillon, OH | 2.0 | 1.0 | 750 | $900 | $1.20 | 21d | 1 | 0.73mi |
| 2220 Harsh Ave SE Unit 2220-HR Massillon, OH | 2.0 | 1.5 | 1080 | $1,299 | $1.20 | 21d | 1 | 1.34mi |
| 2220 Harsh Ave SE Unit 2220-HR Massillon, OH | 2.0 | 1.5 | 1080 | $1,199 | $1.11 | 43d | 1 | 1.34mi |
| 2200 Harsh Ave SE Massillon, OH | 1.0–2.0 | 1.0–1.5 | 811 | $899 | $1.11 | 13d | 1 | 1.38mi |
HOA detail
- Monthly dues
- $540 · $6,480/yr
- Likely covers
- electric
Listing history 10 events
-
2026-06-18pricedays on market $24,000 Active 1 DOM
-
2026-06-17days on market $24,999 Active 70 DOM
-
2026-06-16days on market $24,999 Active 69 DOM
-
2026-06-15days on market $24,999 Active 68 DOM
-
2026-06-13days on market $24,999 Active 66 DOM
-
2026-06-12days on market $24,999 Active 65 DOM
-
2026-06-09days on market $24,999 Active 62 DOM
-
2026-06-08days on market $24,999 Active 61 DOM
-
2026-06-08remarks 699-char remark
-
2026-06-08$24,999 Active 60 DOM
ⓘ Source: listings_history table (triggers on properties + properties_extension) + one-shot
backfill from property_details.listing_events for pre-trigger history.
Climate risk First Street
- Flood 1/10 Low FEMA zone X (unshaded) · 0% chance over 30 yrs
- Wildfire 1/10 Low
- Heat 3/10 Moderate 6 d/yr ≥96°F today · 15 d/yr by 30 yrs out
- Wind 1/10 Low
- Air quality 2/10 Low 0 unhealthy d/yr today · 1 by 30 yrs out
Nearby sold comps map
Loading sold comps map…
Walkable amenities ~0.75 mi
Loading nearby amenities…
Taxation est. · year 1
- Rental income
- $11,049
- − Mortgage interest
- −$1,344
- − Property taxes
- −$360
- − Insurance
- −$120
- − Repairs & maintenance
- −$884
- − Management
- −$884
- − HOA
- −$6,480
- − Depreciation
- −$698
- Taxable income
- $279
- Est. tax owed @ 24.0%
- −$67
- After-tax cash flow
- $191/yr
For passive investors: Depreciation is non-cash, so a rental often shows a tax loss while cash-flowing — sheltering income. Rental losses are passive: they offset passive income freely, and up to $25,000/yr can offset ordinary (W-2) income if you actively participate and your MAGI is under $100k (phasing out to $0 by $150k); unused losses carry forward. On sale, claimed depreciation is recaptured at up to 25%, and gains may owe capital-gains tax (a 1031 exchange can defer both). Figures are a year-1 estimate at your 24.0% rate — not tax advice; consult a CPA.
Schools (NCES district)
- District
- Perry Local
- NCES district ID
- 3904992
- Math proficiency
- 63% ▼ -10.00%
- Reading proficiency
- 73% ▼ -4.00%
- Median HH income
- $51,700
- Composite
- 57.83/100
- National rank
- #1048
- State rank
- #173 of 656 in OH
Livability — Perry Heights
- Score
- 68/100
- State rank
- #575
- US rank
- #9817
Category grades
Schools grade is shown separately in the Schools card above.
Census & demographics
- Census place
- Perry Heights, OH
- County
- Stark County · 272,865 people
- Metro
- Canton-Massillon, OH
- Population (ZIP)
- 47,741
- Household income
- $69,179
- Rent vs Own
- Severe rent burden
- 1011.0
Population outlook (Stark County) Hauer SSP2
- Today (2025)
- 373,708 people
- By 2030
- 371,245 · -0.7%
- By 2040
- 361,331 · -3.3%
- By 2050
- 345,290 · -7.6%
- By 2075
- 302,669 · -19.0%
- By 2100
- 238,870 · -36.1%
Race, ethnicity, and origin ACS 2023
- Neighborhood character
- Predominantly White (86%)
- Race & ethnicity
- White 86% Black 7% Two or more races 5% Hispanic / Latino 3% Asian 1%
- Common ancestry
- Lithuanian 3% Romanian 2% Scandinavian 2%
- Foreign-born
- 2% · Canada, China
- Languages at home
- 97% English-only · Spanish 1% Other Indo-European 1%
Political lean MEDSL · Stark
- 2024 margin
- Strong R (+21.9) · D 38.6% · R 60.5%
- 2008→2024 swing
- -27.4pp toward R · 2008: 5.5pp · 2024: -21.9pp
- All cycles
- 2024: R+21.9 2020: R+18.5 2016: R+17.4 2012: R+0.4 2008: D+5.5
Not yet ingested
- Civics
- —
Market trends
- HPI YoY
- ▼ -190.31%
- Current HPI
- 217.8955
- Rent YoY
- ▲ 6.04%
- Metro
- Canton-Massillon, OH
- State GDP YoY
- ▲ 1.98%
- F500 in state
- 48
Industry mix (Fortune 500 HQ in OH)
| Industry | F500 HQs | Revenue |
|---|---|---|
| Insurance | 3 | $145B |
|
||
| Industrial Machinery | 3 | $49B |
|
||
| Financial Services | 3 | $24B |
|
||
| Consumer Goods | 2 | $93B |
|
||
| Aerospace / Defense | 2 | $47B |
|
||
| Utilities | 2 | $33B |
|
||
Price history
+900.0% since first listed14 events — show timeline
- 2026-05-11 Price Changed $24,999 MLSNOW
- 2026-04-24 Price Changed $27,900 MLSNOW
- 2026-04-08 Listed $29,900 MLSNOW
- 2024-05-07 Sold (MLS) $20,000 MLSNOW
- 2024-04-08 Pending — MLSNOW
- 2024-03-28 Price Changed $18,000 MLSNOW
- 2024-02-20 Relisted — MLSNOW
- 2024-02-16 Listing Removed — MLSNOW
- 2024-01-29 Price Changed $20,000 MLSNOW
- 2023-10-24 Price Changed $23,000 MLSNOW
- 2023-09-04 Price Changed $25,000 MLSNOW
- 2023-08-16 Listed $29,000 MLSNOW
- 2017-04-26 Listing Removed — MLSNOW
- 2017-04-11 Listed $2,500 MLSNOW
Property tax history
+7.8%/yrLatest (2017): $4 · +25.3% YoY. Source: county tax records.
Cash-flow waterfall
monthlySold comps — $/sqft
last 12 mo · ≤1 miLoading sold comps…