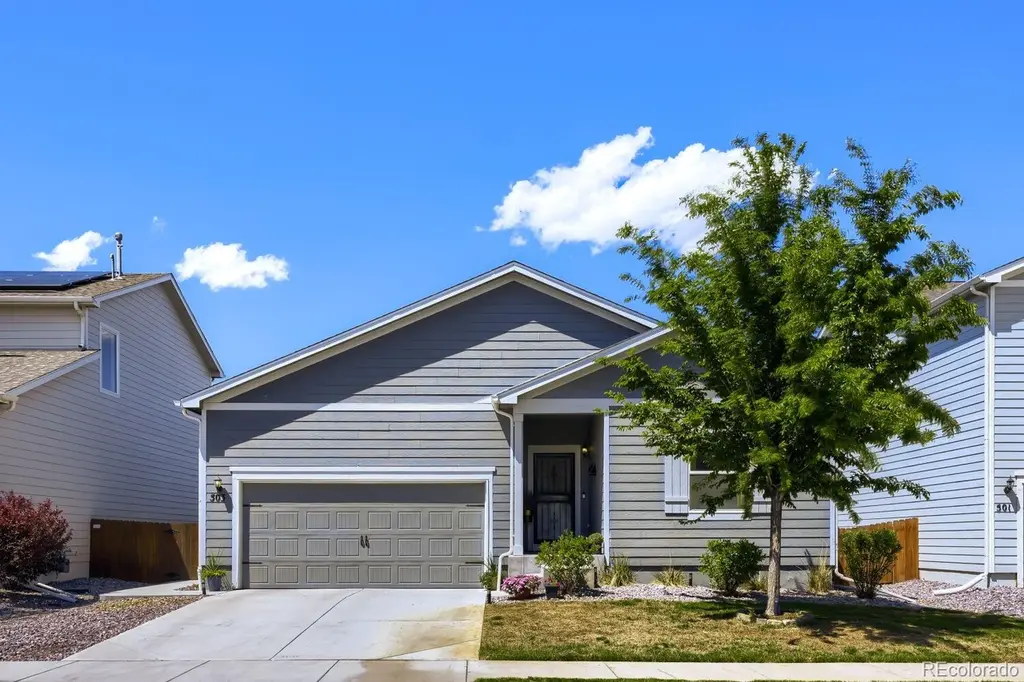
503 Evans Ave
Keenesburg, CO 80643
$429,990D+
3 bd · 2.0 ba ·
1,639 sqft ·
Built 2021
· SingleFamily
· Active
· 23 DOM
Cashflow @ list (25.0% down · 7.5%)
Estimated rent
$4,041/mo
Mortgage (P&I)
−$2,255
Tax + insurance
−$450
HOA
−$40
Vac / Maint / Mgmt
−$849
Net cashflow
$447/mo
Annual
$5,366/yr
Cap rate
7.54%
Cash-on-cash
4.46%
DSCR
1.20
1% rule
0.94%
Cash to close
$120,397
Investor read
- This is a 3-bed/2.0-bath single-family listed at $430k.
- At list price, monthly cash flow is $447 ($5k/yr) — positive.
- The deal already cash-flows at list — no discount required.
- To meet the 1% rule (rent ≥ 1% of price), the offer needs to be $404k (6.0% below list).
- It's been on market 23 days — a 2% lower offer ($424k) is reasonable based on typical stale-listing flexibility.
- Recommended offer: $404k (6.0% below list) — sets the bar for 1% rule.
- Local home prices are declining (-3.0%/yr); year-one equity from $3k of loan paydown is wiped out by about $13k of value loss. Plan a longer hold.
- Location reads 58/100 on livability (#296 in CO) — a working-class tenant base; expect higher turnover. Strengths: housing A+, employment A, crime B; Watch: amenities F, commute F, health & safety F.
- Weld County School District Re-3J (rural): math 18% / reading 31% proficiency, ranked #64 of 86 in CO (top 74%) — low school quality limits family demand, transient renter base, plan for 1-2y turnover.
- Zoned schools: Hoff Elementary School (math 10% / reading 24%, grade F, #747 of 966 statewide, top 80%, 319 students, 42% FRL); Weld Central Middle School (math 12% / reading 27%, grade F, #207 of 270 statewide, top 79%, 525 students, 53% FRL); Weld Central Senior High School (math 22% / reading 42%, grade F, #220 of 381 statewide, top 59%, 697 students, 42% FRL).
- Market conditions: 62 active listings in the ZIP; 3,170 units permitted in Weld County in 2024 (278 in 5+ unit buildings).
- Weld County population projected at +46% by 2050 — long-run rental-demand tailwind backs the buy-and-hold thesis.
- 6 sale attempts since 5y ago with the ask held roughly flat each time — persistent listings suggest the price (not the market) is what's stuck; bring a comps-based counter.
- Climate carrying-cost: moderate wildfire risk — expect insurance premiums to compound above CPI over the hold.
- Cap rate 7.5% vs local median 5.8% in Keenesburg — meaningfully above typical; check what's discounted (condition, days-on-market, listing class) to confirm the premium yield is real.
Questions for listing agent
- What does the HOA fee cover, when was the last increase, and are there any pending special assessments or reserve-fund shortfalls?
- Is there a deadline driving the sale (1031 exchange, divorce, estate, relocation)? That informs how much negotiation room exists.
- Schools are F-rated, which usually means shorter tenancies and higher turnover. Who's the typical renter profile here, and what's been the actual vacancy rate?
- The area grade is low — what's the realistic commute time and amenity access for the typical tenant pool here? Any planned neighborhood developments (good or bad) we should know about?
- What's the average days-on-market for RENTAL listings here right now (not sales)? A rising rental-DOM trend means longer vacancies and softer asking-rent achievability than the comps imply.
- What's the recent tenant-quality profile in this submarket — average credit score on applications, eviction rate, late-payment / NSF rate, and stable-employment percentage? A property-management company in the area should have these aggregated.
- How much new for-sale + rental construction is in the pipeline within 1–3 miles? Heavy new supply typically softens prices + rents 12–24 months out; constrained supply supports both.
CashFlowRE · CFR-C8TY8F9EBAK6YP
· Data 2 days ago
cashflowre.app · 2026-05-29